A scrappy little division that cares a lot about data: a vision for data sciences in DTBE
Chad Heilig — Division of Tuberculosis Elimination, CDC, 2014-03-06 — 49 slides (47 shown; 2 omitted)
This rendering was constructed from an original PowerPoint presentation. Corrections of original text are indicated as “[corrected: X]”, redactions as “[redacted: X]”, and names withheld as “[generalized: X]”. Handouts and other auxiliary sources mentioned in the presentations are not available. The content of each presentation was believed to be correct and valid at the time of the presentation. This content, including references and links within the slides, has not been checked or updated when preparing this site. This rendering was facilitated by Anthropic Claude agentic tools for automated text extraction through computer vision and for assistance with compiling the completed sets.
Setting: A scrappy little division that cares a lot about data: a vision for data sciences in DTBE, 2014-03-06. CDC’s Division of Tuberculosis Elimination.
2014-03-06, warm and breezy. Today I led a presentation that was the offspring of 2 parents: (1) the director of my center, who went around to every division and branch to learn what we do, and (2) a think tank that I led of colleagues with equally little standing but plenty of opinions-turned-evidence. With my branch chief’s full support, I met today’s moment in PowerPoint for “A Scrappy Little Division That Cares a Lot about Data: A Vision for Data Sciences in DTBE”. Hallmark Shoebox meets bureaucrats who care. It’s the first time I’ve used the phrase “data science” with a group. I haven’t figured out whether it’s a vacuous buzz phrase or the key to cracking this thing open. Thinking about data science tasks end to end through a shift in data culture. DTBE is ready; they’re doing most of it already. I want to help them make commitments: a foundation of well-supported tools, mediated rather than haphazard cross-branch problem-solving and sharing and archiving. Like last year’s talk, this one felt magical.
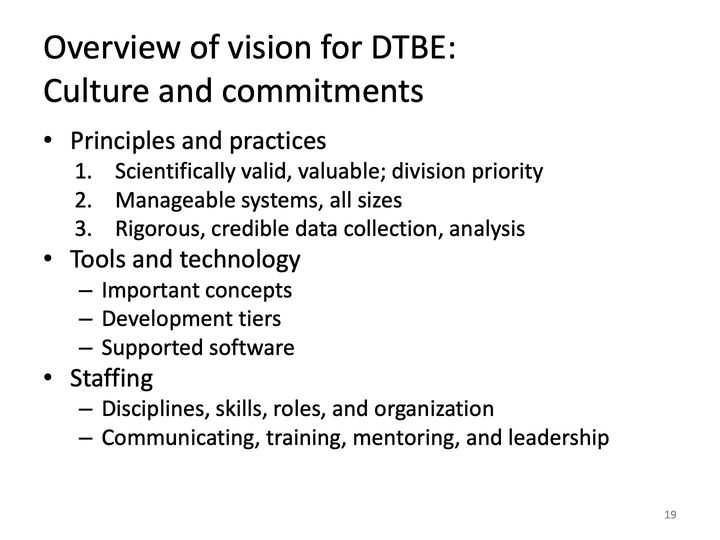
I meant for this presentation to feed into ongoing strategic planning within DTBE for research, program, and staffing, motivated by DTBE’s internal think tank.
Slide 1A scrappy little division that cares a lot about data: a vision for data sciences in DTBE
Chad Heilig, PhD Division of Tuberculosis Elimination 2014-03-06
Abbreviations: DTBE = Division of Tuberculosis Elimination (CDC).
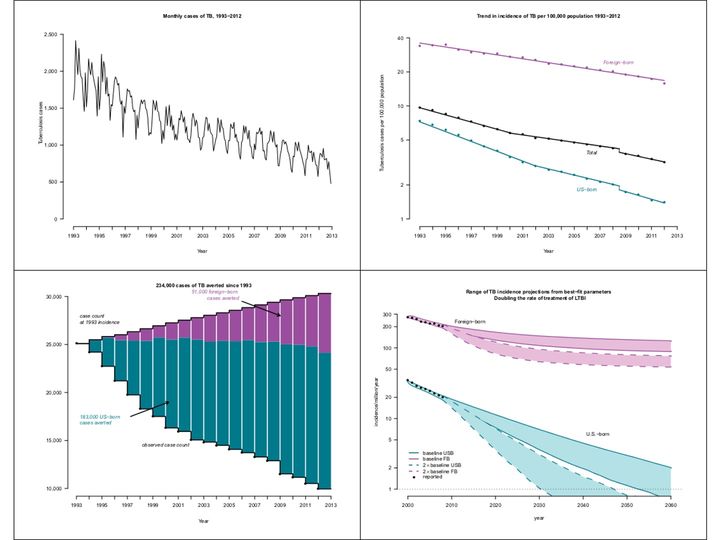
Slide 2[figures: cases of TB averted]
Description
Figure 1
Panels
1 (top left)
Elements
1 jagged black line depicts monthly counts of tuberculosis cases over time
Horizontal
Year, 1993–2013, ticks every 2 years; data run from 1993 to the end of 2012
Vertical
Tuberculosis cases, 0–2,500, ticks every 500; data span about 480 to 2,400
Visible pattern
The line zigzags in an annual saw-tooth pattern falling from left to right.
Figure 2
Panels
1 (top right)
Elements
3 series in 3 colors (purple, black, teal), each of about 20 annual dots with a line, labeled Foreign-born, Total and US-born
Horizontal
Year, 1993–2013, ticks every 2 years; data 1993–2012
Vertical
Tuberculosis cases per 100,000 population, logarithmic scale with ticks at 1, 2, 5, 10, 20 and 40; extent 1 to about 40
Visible pattern
All three series fall from left to right in nearly straight lines on the log scale, with Foreign-born on top, Total in the middle, and US-born at the bottom.
Figure 3
Panels
1 (bottom left)
Elements
Filled region between line graph of cases averted (bottom) and cases projected at 1993 rate (top).
Horizontal
Years, 1993–2013, ticks every year
Vertical
Case counts, 10,000–30,000, ticks every 5,000; no zero
Visible pattern
The 2 step lines start together at about 25,000 in 1993 and diverge. The region between them is shaded in purple (foreign-born cases averted) and teal (US-born cases averted).
Figure 4
Panels
1 (bottom right)
Elements
2 groups (purple for Foreign-born, teal for U.S.-born), each with 2 shaded bands, 1 bounded by solid lines and 1 by dashed lines; legend gives baseline and 2 × baseline lines for USB and FB
Horizontal
year, 2000–2060, ticks every 10 years
Vertical
incidence/million/year, logarithmic scale with ticks at 1, 2, 5, 10, 20, 50, 100, 200 and 300; extent 1 to about 300; dotted horizontal reference line at 1
Visible pattern
The Foreign-born bands decline gently and level off, the solid band ending between about 90 and 130 at 2060 and the dashed band between about 55 and 75. The U.S.-born bands fall more steeply: the solid band ends between about 2 at 2060 and well below 1; the dashed band lies below it.
Text in the picture
Monthly cases of TB, 1993–2012 Tuberculosis cases Year Trend in incidence of TB per 100,000 population 1993–2012 Tuberculosis cases per 100,000 population Foreign-born Total US-born Year 234,000 cases of TB averted since 1993 51,000 foreign-born cases averted case count at 1993 incidence 183,000 US-born cases averted observed case count Year Range of TB incidence projections from best-fit parameters Doubling the rate of treatment of LTBI Foreign-born incidence/million/year U.S.-born baseline USB baseline FB 2 × baseline USB 2 × baseline FB reported year
Abbreviations: FB = foreign-born; LTBI = latent tuberculosis infection; TB = tuberculosis; US = United States; USB = US-born.
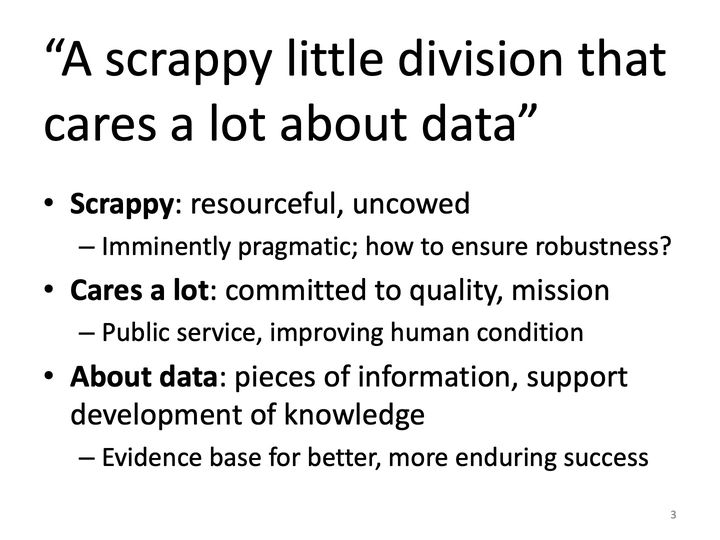
Slide 3“A scrappy little division that cares a lot about data”
Scrappy: resourceful, uncowed
Imminently pragmatic; how to ensure robustness?
Cares a lot: committed to quality, mission
Public service, improving human condition
About data: pieces of information, support development of knowledge
Evidence base for better, more enduring success
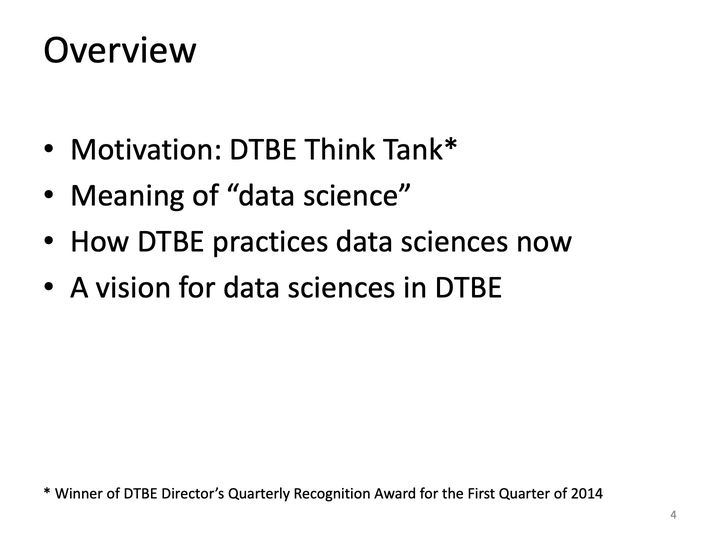
Slide 4Overview
Motivation: DTBE Think Tank*
Meaning of “data science”
How DTBE practices data sciences now
A vision for data sciences in DTBE
* Winner of DTBE Director’s Quarterly Recognition Award for the First Quarter of 2014
Abbreviations: DTBE = Division of Tuberculosis Elimination (CDC).
Slide 5DTBE think tank: on research
Create a “data science activity” to ensure considerations of core research principles and build research capacity
Study design and research methodology
Data management and statistics
Survey or questionnaire design
More data and analytic support for current research and for program evaluation, surveillance, and NTIP
Abbreviations: DTBE = Division of Tuberculosis Elimination (CDC); NTIP = National Tuberculosis Indicators Project (CDC).
Slide 6DTBE think tank: on work force
Greater depth in data management and analysis for all data-driven research and nonresearch activities
Surveillance, evaluation, other program data, novel methods
Cross-branch coordination of data-centered efforts and expertise
Modest increase in FTEs in data sciences (potential net decrease in other areas)
Statisticians, quantitative epidemiologists, information technology specialists; add economics
Study of generalizable extraction of knowledge from data
Builds on techniques and theories from many fields with goal of extracting meaning from data and creating data products
Data engineering, computing and information sciences, scientific method, mathematics and statistics, visualization
Slide 9Data scientists
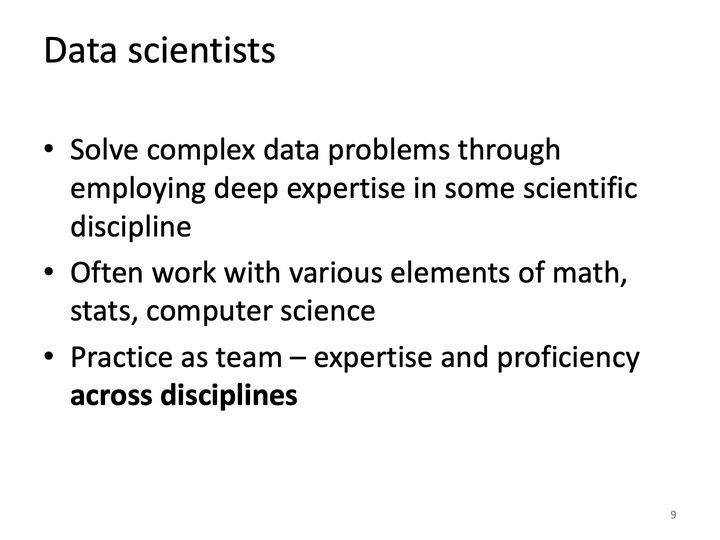
Solve complex data problems through employing deep expertise in some scientific discipline
Often work with various elements of math, stats, computer science
Practice as team – expertise and proficiency across disciplines
Slide 10Data science tasks: end to end
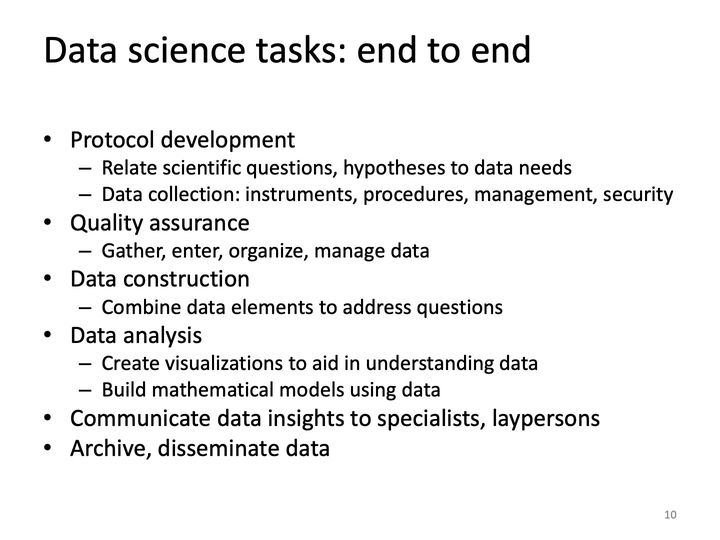
Protocol development
Relate scientific questions, hypotheses to data needs
Data collection: instruments, procedures, management, security
Quality assurance
Gather, enter, organize, manage data
Data construction
Combine data elements to address questions
Data analysis
Create visualizations to aid in understanding data
Build mathematical models using data
Communicate data insights to specialists, laypersons
Archive, disseminate data
Slide 11How DTBE practices data sciences
Abbreviations: DTBE = Division of Tuberculosis Elimination (CDC).
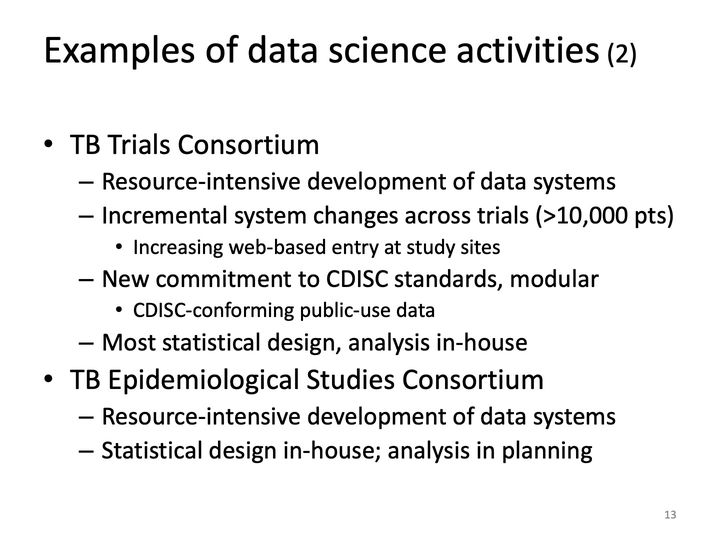
Slide 12Examples of data science activities (1)
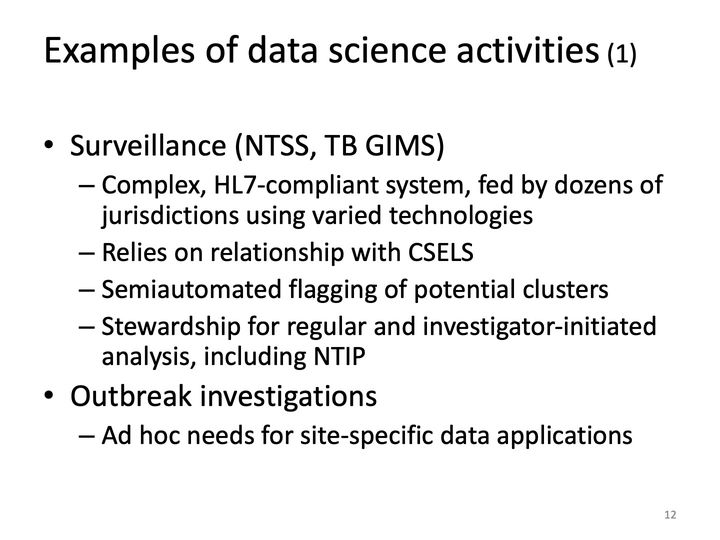
Surveillance (NTSS, TB GIMS)
Complex, HL7-compliant system, fed by dozens of jurisdictions using varied technologies
Relies on relationship with CSELS
Semiautomated flagging of potential clusters
Stewardship for regular and investigator-initiated analysis, including NTIP
Outbreak investigations
Ad hoc needs for site-specific data applications
Abbreviations: CSELS = Center for Surveillance, Epidemiology, and Laboratory Services (CDC); GIMS = Genotyping Information Management System (TB GIMS, CDC); HL7 = Health Level Seven (standards for exchanging health data); NTIP = National Tuberculosis Indicators Project (CDC); NTSS = National Tuberculosis Surveillance System (CDC); TB = tuberculosis.
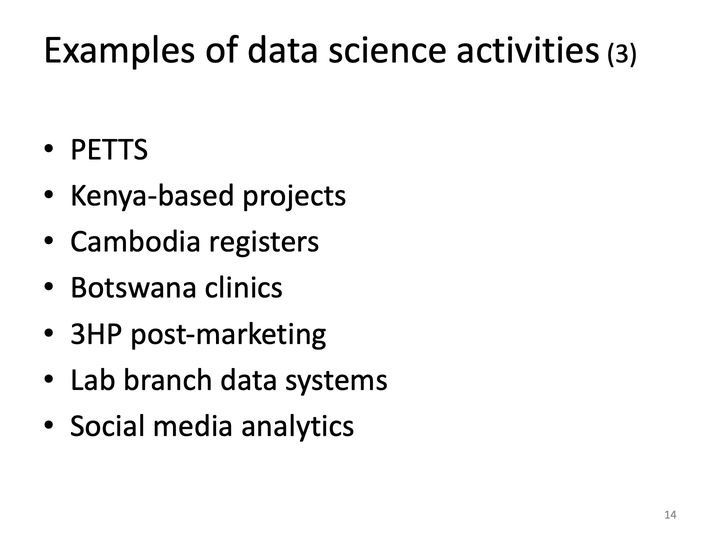
Slide 13Examples of data science activities (2)
TB Trials Consortium
Resource-intensive development of data systems
Incremental system changes across trials (>10,000 pts)
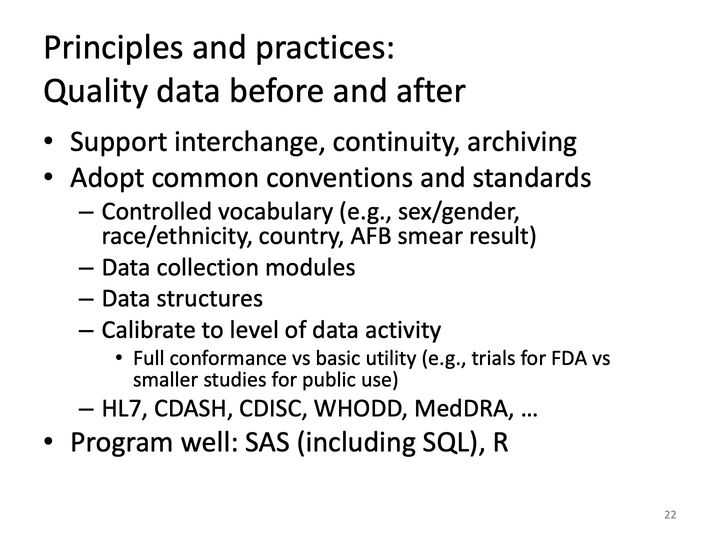
Full conformance vs basic utility (e.g., trials for FDA vs smaller studies for public use)
HL7, CDASH, CDISC, WHODD, MedDRA, …
Program well: SAS (including SQL), R
Abbreviations: AFB = acid-fast bacilli; CDASH = Clinical Data Acquisition Standards Harmonization (a CDISC standard); CDISC = Clinical Data Interchange Standards Consortium; FDA = Food and Drug Administration (US); HL7 = Health Level Seven (standards for exchanging health data); MedDRA = Medical Dictionary for Regulatory Activities; SQL = Structured Query Language; WHODD = WHO Drug Dictionary.
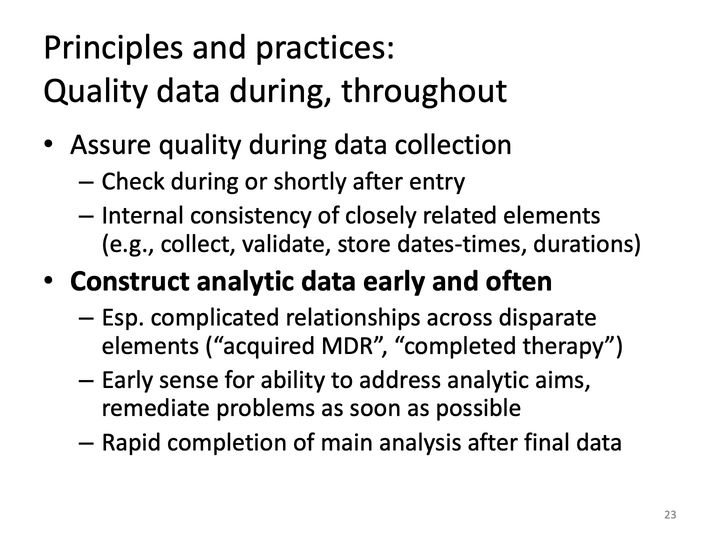
Slide 23Principles and practices: Quality data during, throughout
Assure quality during data collection
Check during or shortly after entry
Internal consistency of closely related elements
(e.g., collect, validate, store dates-times, durations)
Construct analytic data early and often
Esp. complicated relationships across disparate elements (“acquired MDR”, “completed therapy”)
Early sense for ability to address analytic aims, remediate problems as soon as possible
Rapid completion of main analysis after final data
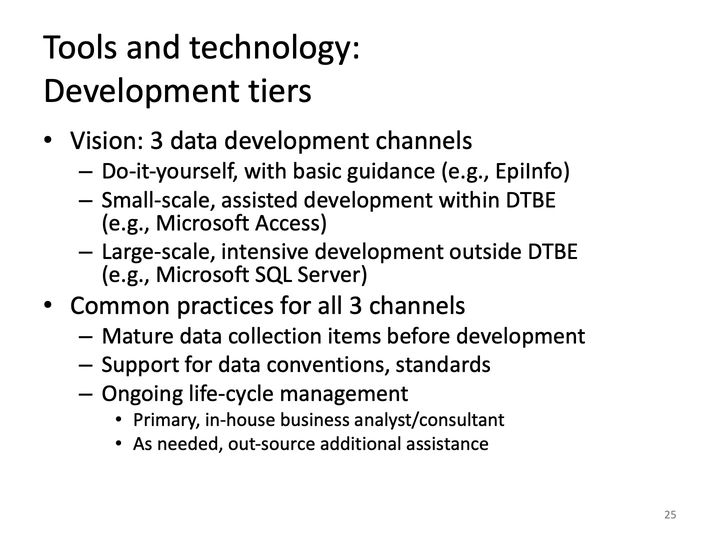
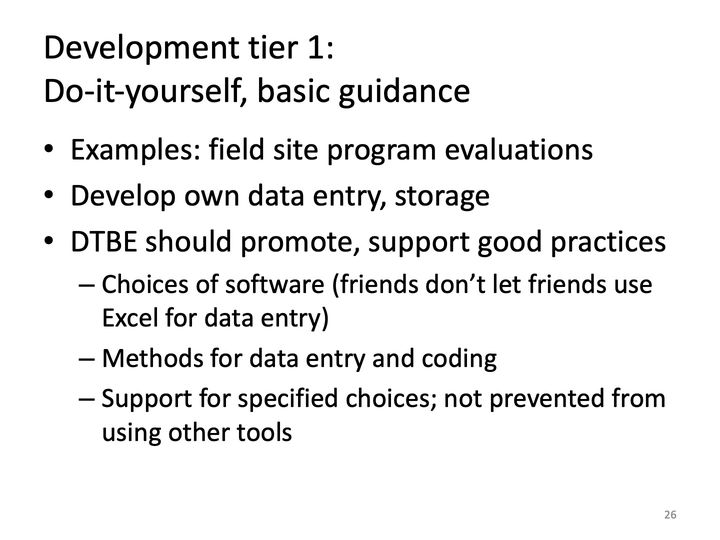
Choices of software (friends don’t let friends use Excel for data entry)
Methods for data entry and coding
Support for specified choices; not prevented from using other tools
Abbreviations: DTBE = Division of Tuberculosis Elimination (CDC).
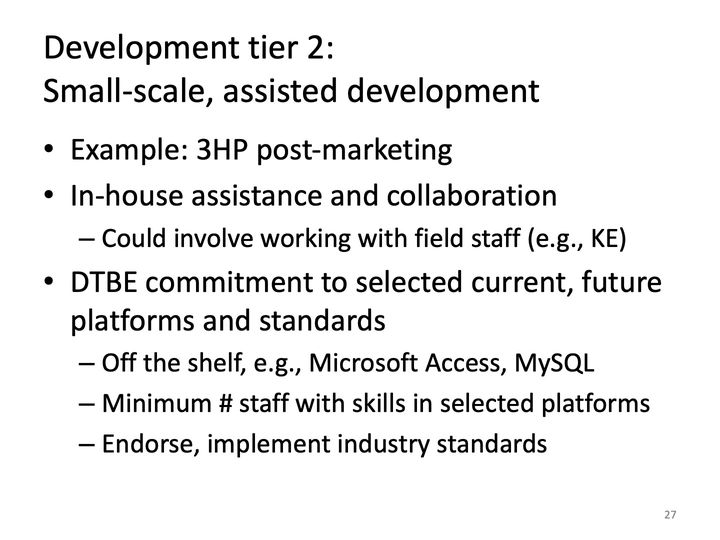
Slide 27Development tier 2: Small-scale, assisted development
Example: 3HP post-marketing
In-house assistance and collaboration
Could involve working with field staff (e.g., KE)
DTBE commitment to selected current, future platforms and standards
Off the shelf, e.g., Microsoft Access, MySQL
Minimum # staff with skills in selected platforms
Endorse, implement industry standards
Abbreviations: 3HP = 3 months of once-weekly isoniazid (H) plus rifapentine (P): the 12-dose regimen for latent TB infection; DTBE = Division of Tuberculosis Elimination (CDC); KE = Kenya.
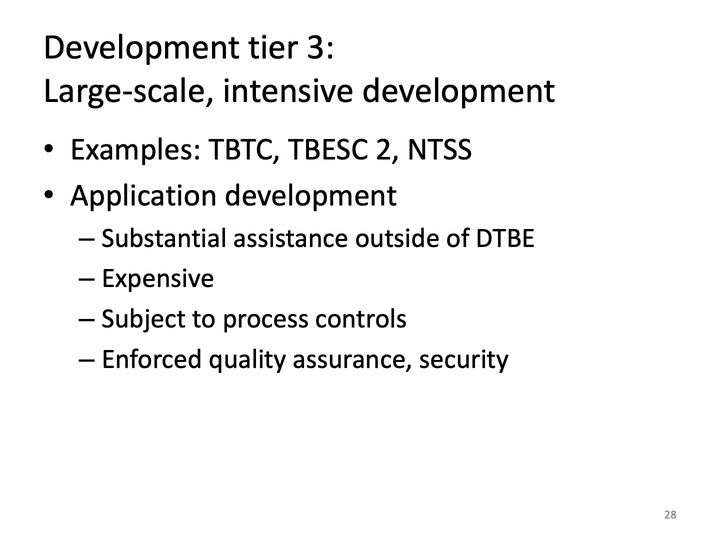
Slide 28Development tier 3: Large-scale, intensive development
Examples: TBTC, TBESC 2, NTSS
Application development
Substantial assistance outside of DTBE
Expensive
Subject to process controls
Enforced quality assurance, security
Abbreviations: DTBE = Division of Tuberculosis Elimination (CDC); NTSS = National Tuberculosis Surveillance System (CDC); TBESC = Tuberculosis Epidemiologic Studies Consortium (CDC); TBTC = Tuberculosis Trials Consortium (CDC-sponsored).
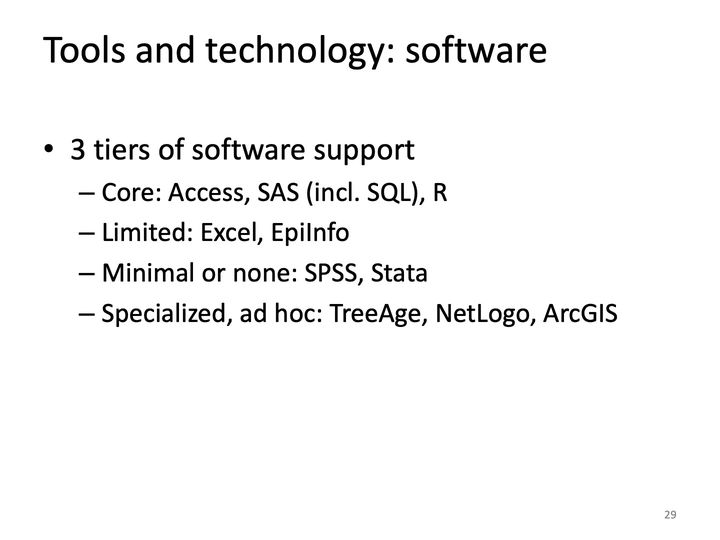
Slide 29Tools and technology: software
3 tiers of software support
Core: Access, SAS (incl. SQL), R
Limited: Excel, EpiInfo
Minimal or none: SPSS, Stata
Specialized, ad hoc: TreeAge, NetLogo, ArcGIS
Abbreviations: SQL = Structured Query Language.
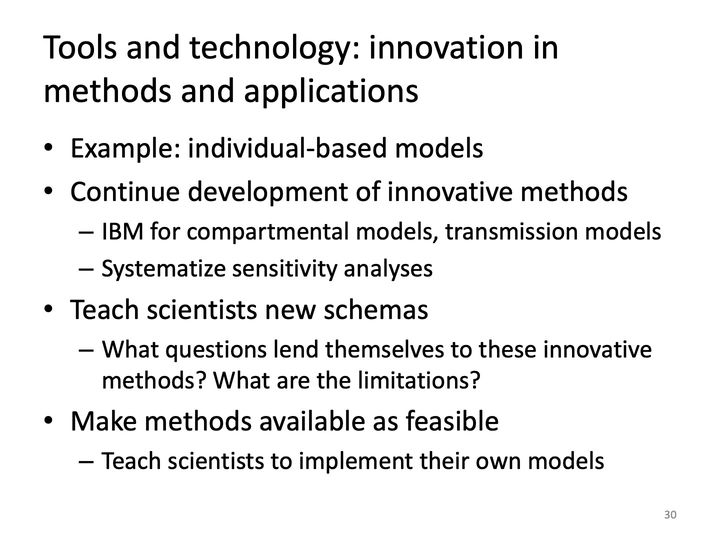
Slide 30Tools and technology: innovation in methods and applications
Example: individual-based models
Continue development of innovative methods
IBM for compartmental models, transmission models
Systematize sensitivity analyses
Teach scientists new schemas
What questions lend themselves to these innovative methods? What are the limitations?
Make methods available as feasible
Teach scientists to implement their own models
Abbreviations: IBM = individual-based model.
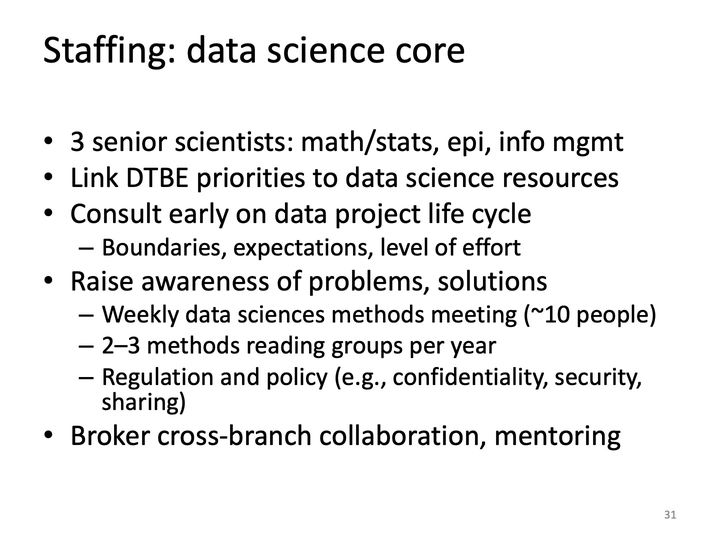
Slide 31Staffing: data science core
3 senior scientists: math/stats, epi, info mgmt
Link DTBE priorities to data science resources
Consult early on data project life cycle
Boundaries, expectations, level of effort
Raise awareness of problems, solutions
Weekly data sciences methods meeting (~10 people)
2–3 methods reading groups per year
Regulation and policy (e.g., confidentiality, security, sharing)
Broker cross-branch collaboration, mentoring
Abbreviations: DTBE = Division of Tuberculosis Elimination (CDC).
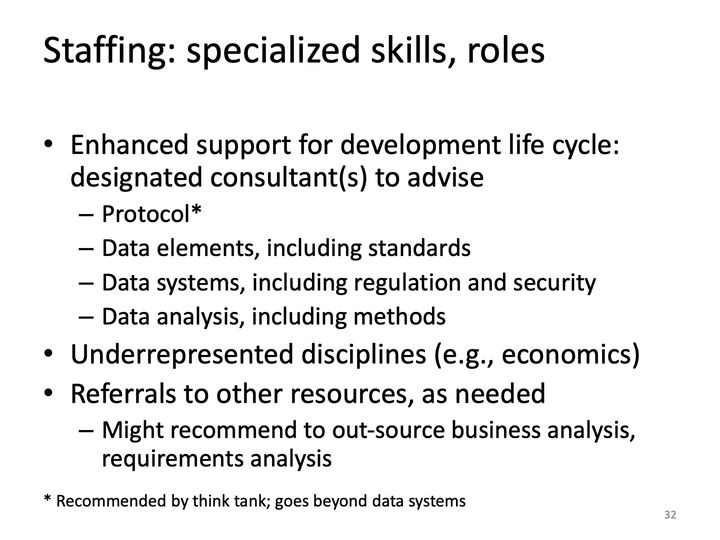
Slide 32Staffing: specialized skills, roles
Enhanced support for development life cycle:
designated consultant(s) to advise
Protocol*
Data elements, including standards
Data systems, including regulation and security
Data analysis, including methods
Underrepresented disciplines (e.g., economics)
Referrals to other resources, as needed
Might recommend to out-source business analysis, requirements analysis
* Recommended by think tank; goes beyond data systems
Slide 33Staffing: distributed skills, roles
Within-branch practices (esp. epi, stats) supported by experienced scientists, analysts
Where possible, build capacity within branches
Early planning for advanced needs outside branch
(e.g., splines, recursive partitioning)
Cross-branch sharing of data, analysis practices
Ongoing mentoring
Slide 34Conclusion: a shift in data culture
Total number of data science staff (FTE+contractors) is likely close to meet anticipated needs
Location, distribution, configuration could be evaluated
More, earlier involvement of experienced data scientists could require modest additional capacity
Need explicit succession planning to ensure continuity
A few new roles are contemplated
“Data science core” cross-branch leadership
Advisor(s) over data system life cycle
Might improve coverage of some disciplines (econ)
No specific organizational proposal at this time
Abbreviations: FTE+contractors = full-time equivalent (staff) plus contractors.
Slide 35Conclusion: commitments
Set of well-supported tools
Set a reliable foundation, not limit options; requires ongoing (though not large) investment
Cross-branch problem-solving and sharing
Already happens, often haphazardly; make more systematic but not institutionally burdensome
To be led and mediated by data science core
Sharing and archiving (esp. data and code)
Slide 36Discussion
[redacted: email address] www.cdc.gov/tb
Slide 37 is omitted.
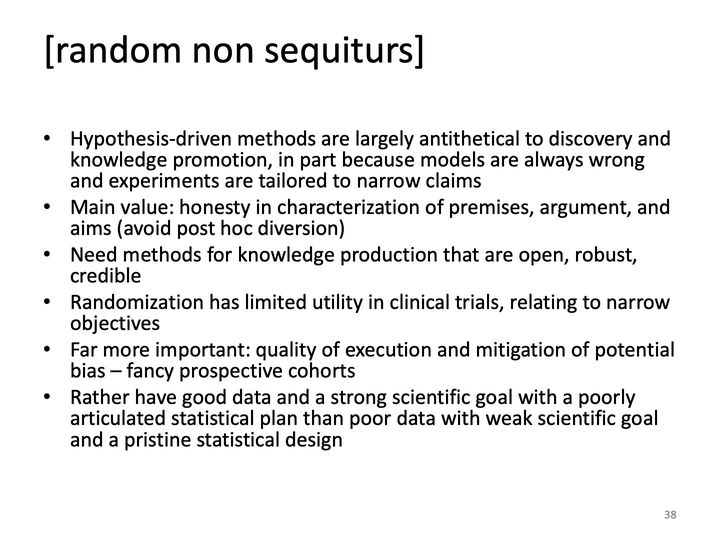
Slide 38[random non sequiturs]
Hypothesis-driven methods are largely antithetical to discovery and knowledge promotion, in part because models are always wrong and experiments are tailored to narrow claims
Main value: honesty in characterization of premises, argument, and aims (avoid post hoc diversion)
Need methods for knowledge production that are open, robust, credible
Randomization has limited utility in clinical trials, relating to narrow objectives
Far more important: quality of execution and mitigation of potential bias – fancy prospective cohorts
Rather have good data and a strong scientific goal with a poorly articulated statistical plan than poor data with weak scientific goal and a pristine statistical design
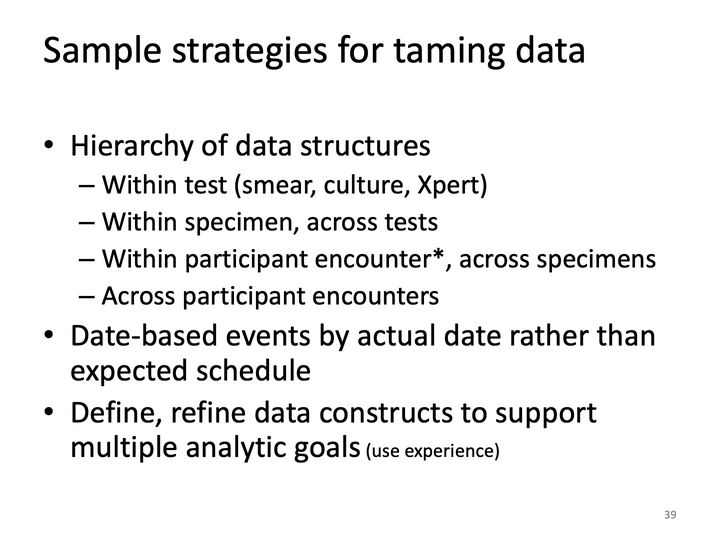
Slide 39Sample strategies for taming data
Hierarchy of data structures
Within test (smear, culture, Xpert)
Within specimen, across tests
Within participant encounter*, across specimens
Across participant encounters
Date-based events by actual date rather than expected schedule
Define, refine data constructs to support multiple analytic goals (use experience)
Abbreviations: Xpert = Xpert MTB/RIF (Cepheid GeneXpert cartridge nucleic acid amplification test for TB and rifampicin resistance).
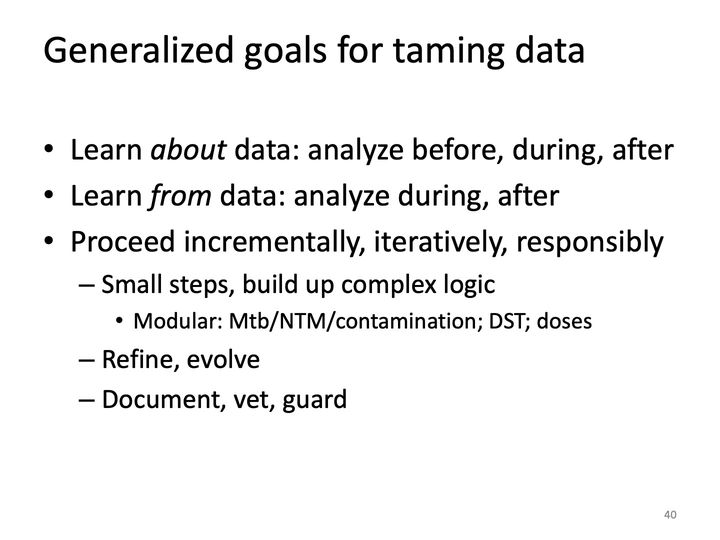
Slide 40Generalized goals for taming data
Learn about data: analyze before, during, after
Learn from data: analyze during, after
Proceed incrementally, iteratively, responsibly
Small steps, build up complex logic
Modular: Mtb/NTM/contamination; DST; doses
Refine, evolve
Document, vet, guard
Abbreviations: DST = drug susceptibility testing; Mtb = Mycobacterium tuberculosis (the bacterium that causes TB); NTM = nontuberculous mycobacteria.
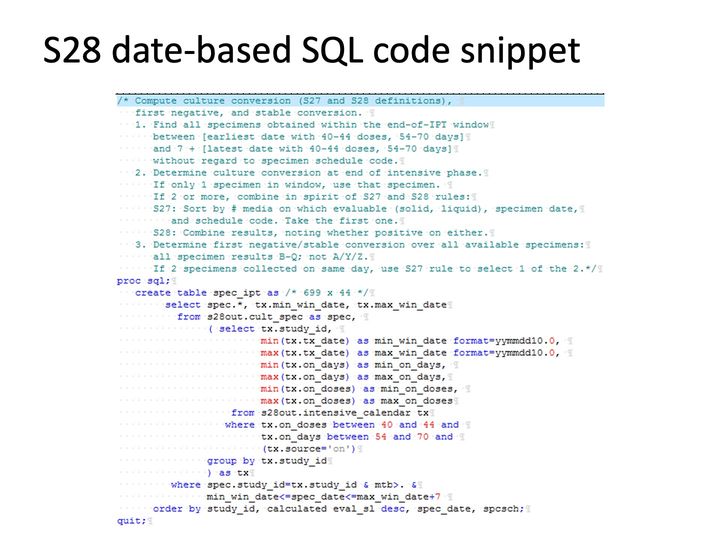
SAS/SQL code with a 15-line comment and 21-line Proc SQL Select statement to determine culture conversion and stable conversion.
Abbreviations: S28 = TBTC Study 28 (moxifloxacin vs isoniazid in the intensive phase of TB treatment); SQL = Structured Query Language.
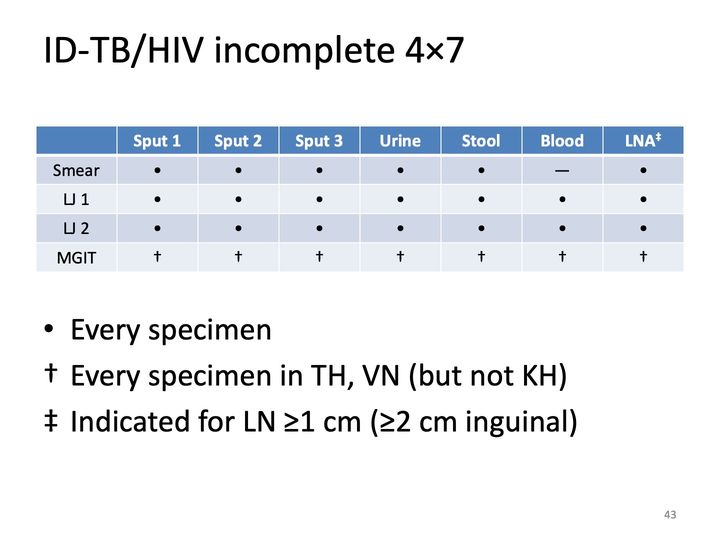
Slide 43ID-TB/HIV incomplete 4×7
Sput 1
Sput 2
Sput 3
Urine
Stool
Blood
LNA‡
Smear
•
•
•
•
•
—
•
LJ 1
•
•
•
•
•
•
•
LJ 2
•
•
•
•
•
•
•
MGIT
†
†
†
†
†
†
†
Every specimen
Every specimen in TH, VN (but not KH)
Indicated for LN ≥1 cm (≥2 cm inguinal)
Abbreviations: HIV = human immunodeficiency virus; ID = Improving Diagnosis of TB in People Living with HIV (study); KH = Cambodia; LJ = Löwenstein–Jensen (egg-based solid culture medium for mycobacteria); LN = lymph node; LNA = lymph node aspirate; MGIT = Mycobacteria Growth Indicator Tube (liquid culture system); TB = tuberculosis; TH = Thailand; VN = Vietnam.
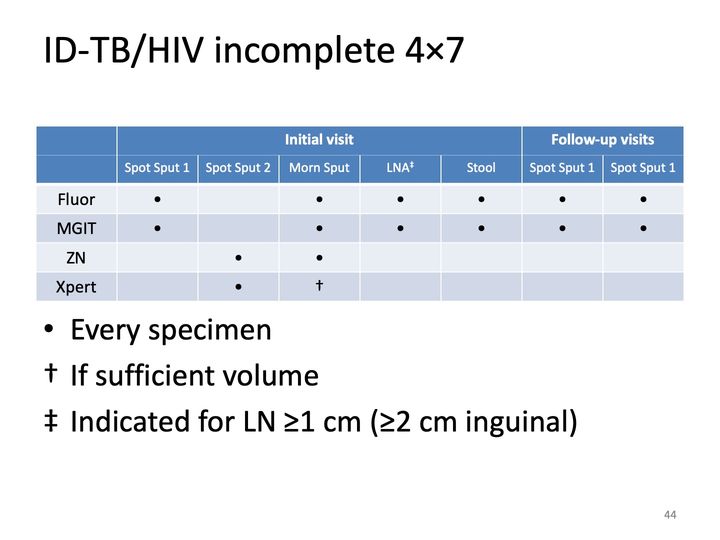
Slide 44[corrected: Kenya ICF 4×7]
Initial visit
Follow-up visits
Spot Sput 1
Spot Sput 2
Morn Sput
LNA‡
Stool
Spot Sput 1
[corrected: Spot Sput 2]
Fluor
•
•
•
•
•
•
MGIT
•
•
•
•
•
•
ZN
•
•
Xpert
•
†
Every specimen
If sufficient volume
Indicated for LN ≥1 cm (≥2 cm inguinal)
Abbreviations: ICF = intensified case finding; LN = lymph node; LNA = lymph node aspirate; MGIT = Mycobacteria Growth Indicator Tube (liquid culture system); Xpert = Xpert MTB/RIF (Cepheid GeneXpert cartridge nucleic acid amplification test for TB and rifampicin resistance); ZN = Ziehl–Neelsen (acid-fast stain for smear microscopy).
Slide 45Data scientists
“The information and computer scientists, database and software and programmers, disciplinary experts, curators and expert annotators, librarians, archivists, and others, who are crucial to successful management of a digital data collection”
“Assists in the planning, collection, transformation, analysis, and reporting of clinical trial data and communication of their results. … crucial to determination of safety and efficacy of novel therapeutic compounds.”
Slide 46Paradoxes (1)
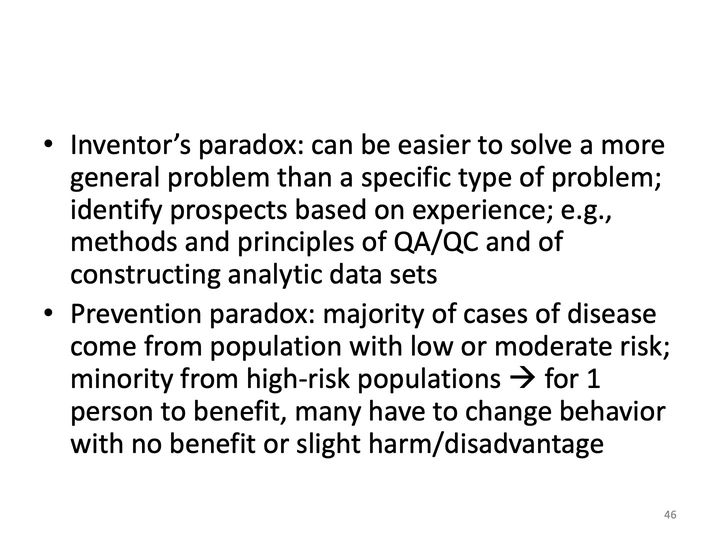
Inventor’s paradox: can be easier to solve a more general problem than a specific type of problem; identify prospects based on experience; e.g., methods and principles of QA/QC and of constructing analytic data sets
Prevention paradox: majority of cases of disease come from population with low or moderate risk; minority from high-risk populations → for 1 person to benefit, many have to change behavior with no benefit or slight harm/disadvantage
Heilig CM, Feng P-JI, Joloba ML, Johnson JL, Morgan K, Gitta P, Boom WH, Mayanja-Kizza H, Eisenach KD, Bozeman L, Goldberg SV. How we determined the most reliable solid medium for studying treatment of tuberculosis. Tuberculosis. 2014-05; 94(3): 317–322.Elsewhere on the web (opens in a new tab)
Hill AN, Becerra JE, Castro KG. Modelling tuberculosis trends in the USA. Epidemiology and Infection. 2012-10; 140(10): 1862–1872.Elsewhere on the web (opens in a new tab)
Joloba ML, Johnson JL, Feng P-JI, Bozeman L, Goldberg SV, Morgan K, Gitta P, Boom HW, Heilig CM, Mayanja-Kizza H, Eisenach KD. What is the most reliable solid culture medium for tuberculosis treatment trials? Tuberculosis. 2014-05; 94(3): 311–316.Elsewhere on the web (opens in a new tab)
Mac Kenzie WR, Heilig CM, Bozeman L, Johnson JL, Muzanye G, Dunbar D, Jost KC, Diem L, Metchock B, Eisenach K, et al. Geographic differences in time to culture conversion in liquid media: Tuberculosis Trials Consortium study 28. Culture conversion is delayed in Africa. PLOS ONE. 2011-04-11; 6(4): e18358.Elsewhere on the web (opens in a new tab)