Data whispering: gently taming complex laboratory data for tuberculosis research
This rendering was constructed from an original PowerPoint presentation. Corrections of original text are indicated as “[corrected: X]”, redactions as “[redacted: X]”, and names withheld as “[generalized: X]”. Handouts and other auxiliary sources mentioned in the presentations are not available. The content of each presentation was believed to be correct and valid at the time of the presentation. This content, including references and links within the slides, has not been checked or updated when preparing this site. This rendering was facilitated by Anthropic Claude agentic tools for automated text extraction through computer vision and for assistance with compiling the completed sets.
Setting: Data whispering: gently taming complex laboratory data for tuberculosis research, 2013-03-14. CDC’s Division of Tuberculosis Elimination.
2013-03-14, sunny and cool. Can I bring The Little Prince‘s apprivoiser to tuberculosis data? These data are partial, a little messy, from real laboratories and real illness. I gave a talk, “Data Whispering: Gently Taming Complex Laboratory Data for Tuberculosis Research”. Gave doesn’t capture it, more like declaimed or manifested for the Division of Tuberculosis Delimitation. Opening slide: “No data were harmed in the making of this presentation.” Closing slide: Learn about the data. Learn from the data. Proceed incrementally, iteratively, responsibly. Build up complex logic through small steps. Refine, evolve; document, vet, guard. This talk feels like everything I want my career to be. I can do good things. I can help this division do good things. My branch chief believes it too; he believed it in me before I had a talk to put it in, back when it was just a way I worked. I ride that high. Who wouldn’t.
This presentation draws lessons from 4 DTBE lab-intensive studies: TBTC Study 28, TBTC NAA2m, ID-TB/HIV (Southeast Asia) and Kenya ICF. They are offered as “Some insights, humbly offered” that “Extend beyond lab data”. For each study it pairs the raw laboratory data with the “Goals for analytic data”. “Sample strategies for taming data” lays out a hierarchy of data structures (test → specimen → encounter → across encounters), events dated “by actual date rather than expected schedule”, and constructs refined “to support multiple analytic goals”. An event-history plot of TBTC Study 24 depicts baseline status, endpoints, durations and adverse events in one graphic.
Works referred to
- Cain et al. (2010)Elsewhere on the web (opens in a new tab)
- Reves et al. (2014)Elsewhere on the web (opens in a new tab)
Related works, not cited
- Heilig et al. (2014)Elsewhere on the web (opens in a new tab)
- Joloba et al. (2014)Elsewhere on the web (opens in a new tab)
- Mac Kenzie et al. (2011)Elsewhere on the web (opens in a new tab)
Full references: this page · whole site, by domain (opens in a new tab) · whole site, by type of work (opens in a new tab)
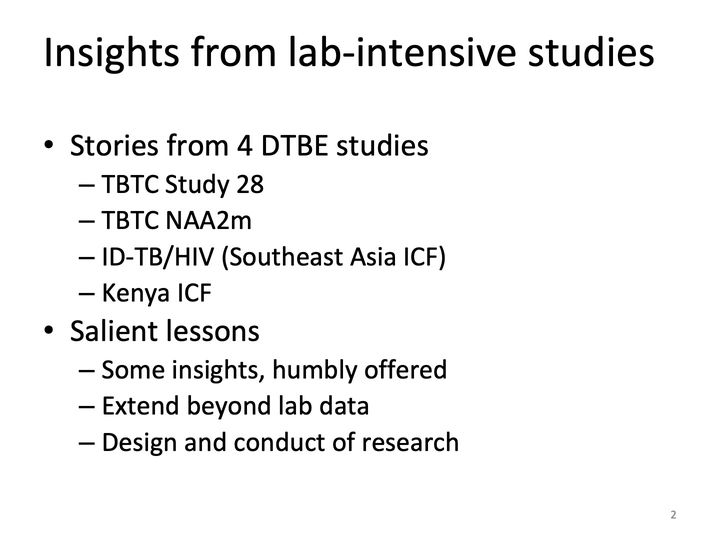
Abbreviations: DTBE = Division of Tuberculosis Elimination (CDC); HIV = human immunodeficiency virus; ICF = intensified case finding; ID = Improving Diagnosis of TB in People Living with HIV (study); NAA2m = TBTC Study NAA2m: a TBTC–TBRU collaborative study (Uganda, 2008–2010) of nucleic acid amplification tests and other markers of treatment response; TB = tuberculosis; TBTC = Tuberculosis Trials Consortium (CDC-sponsored).
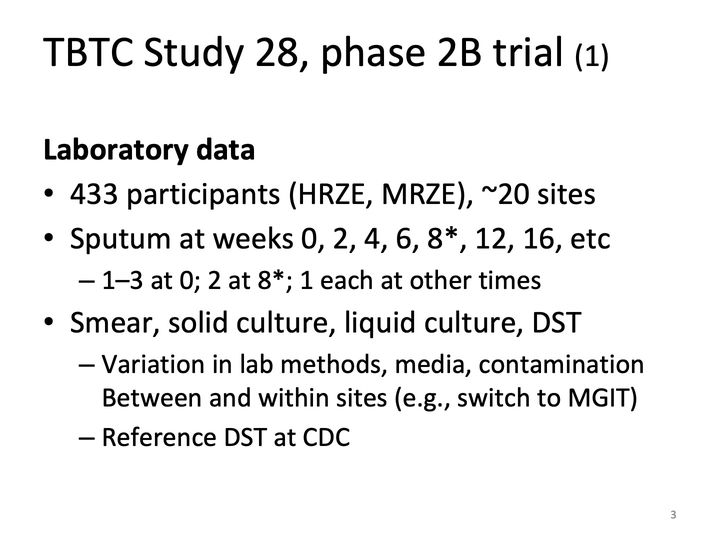
Abbreviations: CDC = Centers for Disease Control and Prevention; DST = drug susceptibility testing; HRZE = isoniazid (H), rifampin (R), pyrazinamide (Z), ethambutol (E): the standard 4-drug regimen; MGIT = Mycobacteria Growth Indicator Tube (liquid culture system); MRZE = moxifloxacin (M), rifampin (R), pyrazinamide (Z), ethambutol (E): moxifloxacin substituted for isoniazid; TBTC = Tuberculosis Trials Consortium (CDC-sponsored).
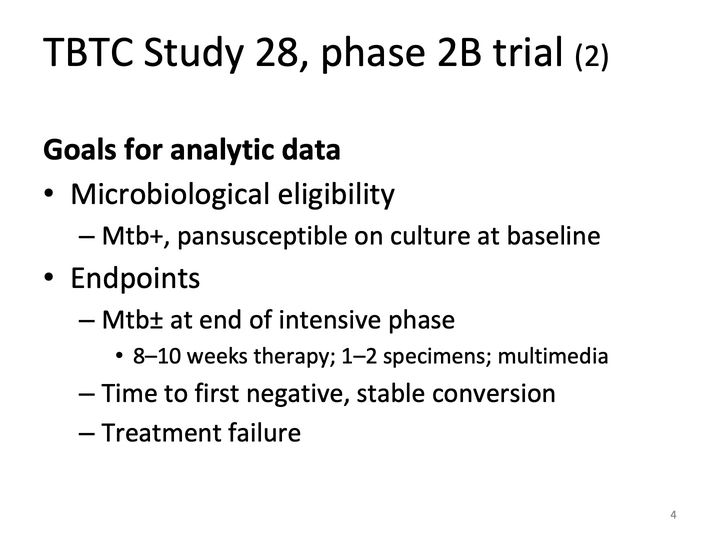
Abbreviations: Mtb = Mycobacterium tuberculosis (the bacterium that causes TB); TBTC = Tuberculosis Trials Consortium (CDC-sponsored).
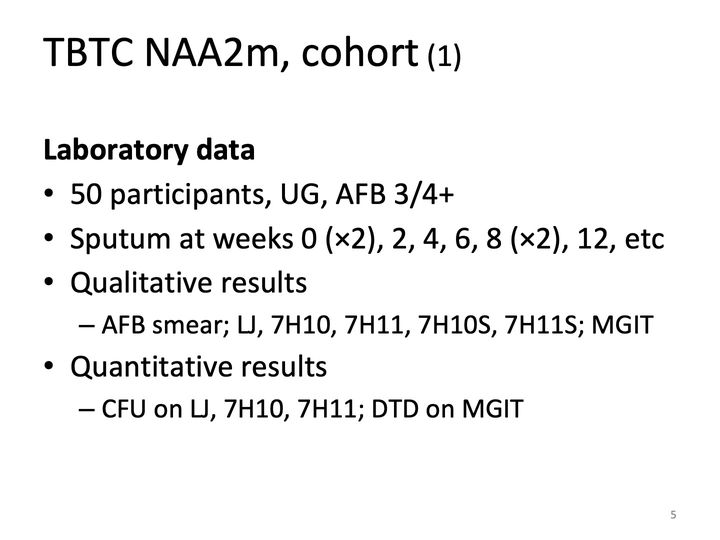
Abbreviations: 7H10 = Middlebrook 7H10 agar (solid culture medium for mycobacteria); 7H10S = Middlebrook 7H10 agar, selective (with added antibiotics to suppress contaminants); 7H11 = Middlebrook 7H11 agar (solid culture medium for mycobacteria); 7H11S = Middlebrook 7H11 agar, selective (e.g. Mitchison's selective 7H11); AFB = acid-fast bacilli; CFU = colony-forming unit(s); DTD = days to detection (time until a liquid MGIT culture signals positive); LJ = Löwenstein–Jensen (egg-based solid culture medium for mycobacteria); MGIT = Mycobacteria Growth Indicator Tube (liquid culture system); NAA2m = TBTC Study NAA2m: a TBTC–TBRU collaborative study (Uganda, 2008–2010) of nucleic acid amplification tests and other markers of treatment response; TBTC = Tuberculosis Trials Consortium (CDC-sponsored); UG = Uganda.
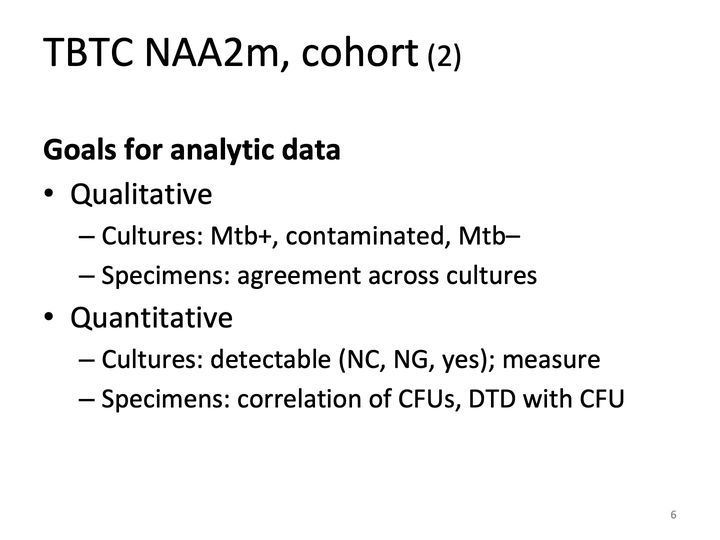
Abbreviations: CFU = colony-forming unit(s); DTD = days to detection (time until a liquid MGIT culture signals positive); Mtb = Mycobacterium tuberculosis (the bacterium that causes TB); NAA2m = TBTC Study NAA2m: a TBTC–TBRU collaborative study (Uganda, 2008–2010) of nucleic acid amplification tests and other markers of treatment response; NC = not countable; NG = no growth; TBTC = Tuberculosis Trials Consortium (CDC-sponsored).
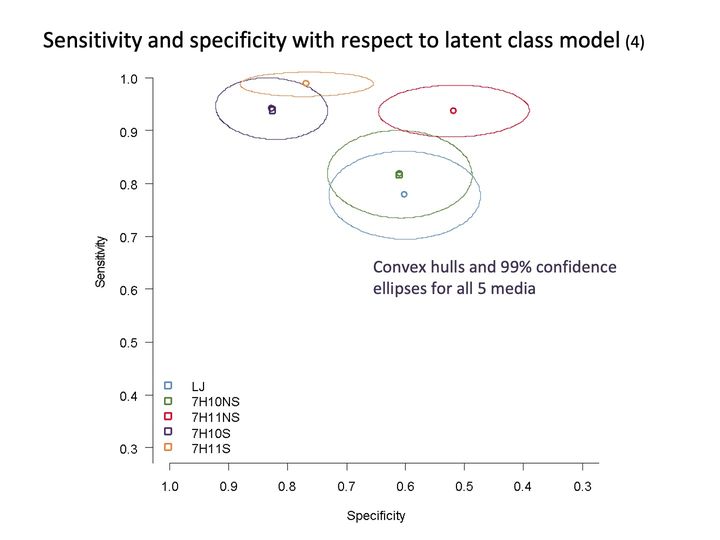
- Panels
- 1
- Elements
- 5 open point markers in 5 colors, each surrounded by an ellipse of the same color, depict sensitivity and specificity for 5 media named in a legend at lower left: LJ (blue), 7H10NS (green), 7H11NS (red), 7H10S (purple), 7H11S (orange)
- Horizontal
- Specificity, 1.0 to 0.3, decreasing from left to right
- Vertical
- Sensitivity, 0.3 to 1.0; ellipses span about 0.69 to 1.0
- Visible pattern
- All 5 ellipses sit above sensitivity of about 0.7. Purple (7H10S) and orange (7H11S) ellipses overlap at the upper left, around specificity 0.75 to 0.85 and sensitivity 0.9 to 1.0, Red (7H11NS) ellipse around specificity 0.5. Green (7H10NS) and blue (LJ) ellipses overlap in the middle, around specificity 0.6 and sensitivity 0.7 to 0.9. Every ellipse is wider than it is tall.
Abbreviations: 7H10NS = Middlebrook 7H10 agar, nonselective (without added antibiotics); 7H10S = Middlebrook 7H10 agar, selective (with added antibiotics to suppress contaminants); 7H11NS = Middlebrook 7H11 agar, nonselective; 7H11S = Middlebrook 7H11 agar, selective (e.g. Mitchison's selective 7H11); LJ = Löwenstein–Jensen (egg-based solid culture medium for mycobacteria).
- Panels
- 1
- Elements
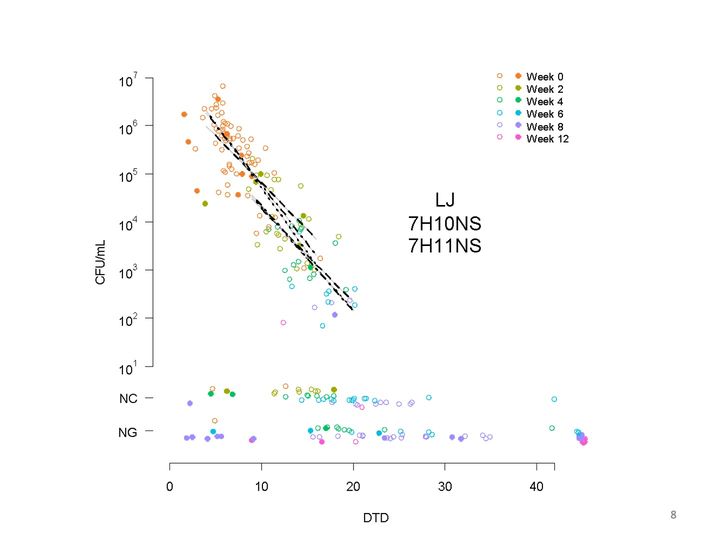
- Open and filled circles in 6 colors depict CFU/mL against DTD; the legend at upper right pairs an open and a filled circle for each of Week 0 (orange), Week 2 (olive), Week 4 (green), Week 6 (cyan), Week 8 (lavender) and Week 12 (pink). Fitted line segments run through the main scatter of points, labeled "LJ / 7H10NS / 7H11NS". Below the log scale, rows of jittered points labeled NC and NG.
- Horizontal
- DTD, 0 to 40 (ticks every 10); axis line ends at 42; points from about 2 to 42, with additional points beyond the right extent.
- Vertical
- CFU/mL, log scale 10^1 to 10^7, then 2 categorical rows below, NC and NG
- Visible pattern
- Points scattered in 3 groups: an oval field from top left to center and 2 bands at labels NC and NG. Colors nearly follow hue gradient from left to right. Line segments depict models fitted to values with observed DTD and CFU.
Abbreviations: 7H10NS = Middlebrook 7H10 agar, nonselective (without added antibiotics); 7H11NS = Middlebrook 7H11 agar, nonselective; CFU = colony-forming unit(s); DTD = days to detection (time until a liquid MGIT culture signals positive); LJ = Löwenstein–Jensen (egg-based solid culture medium for mycobacteria); NC = not countable; NG = no growth.
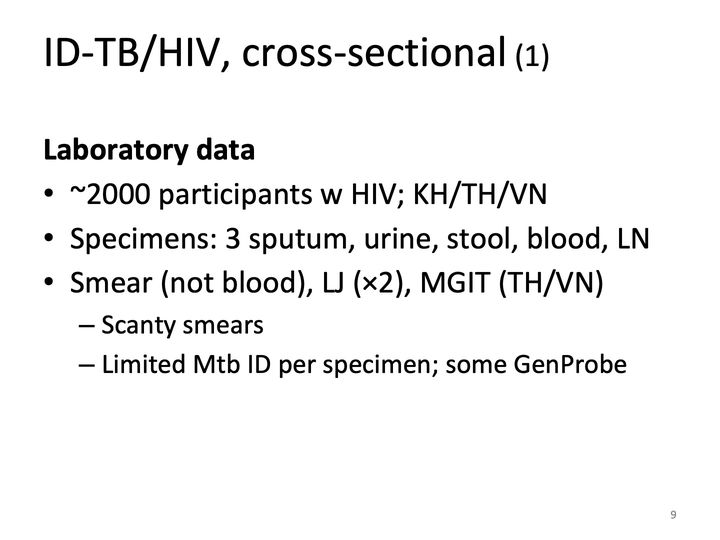
Abbreviations: HIV = human immunodeficiency virus; ID = Improving Diagnosis of TB in People Living with HIV (study); KH = Cambodia; LJ = Löwenstein–Jensen (egg-based solid culture medium for mycobacteria); LN = lymph node; MGIT = Mycobacteria Growth Indicator Tube (liquid culture system); Mtb = Mycobacterium tuberculosis (the bacterium that causes TB); TB = tuberculosis; TH = Thailand; VN = Vietnam.
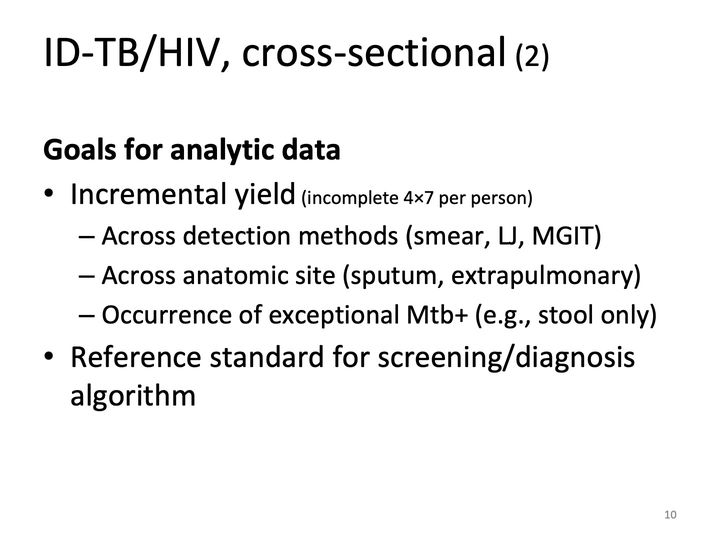
Abbreviations: HIV = human immunodeficiency virus; ID = Improving Diagnosis of TB in People Living with HIV (study); LJ = Löwenstein–Jensen (egg-based solid culture medium for mycobacteria); MGIT = Mycobacteria Growth Indicator Tube (liquid culture system); TB = tuberculosis.
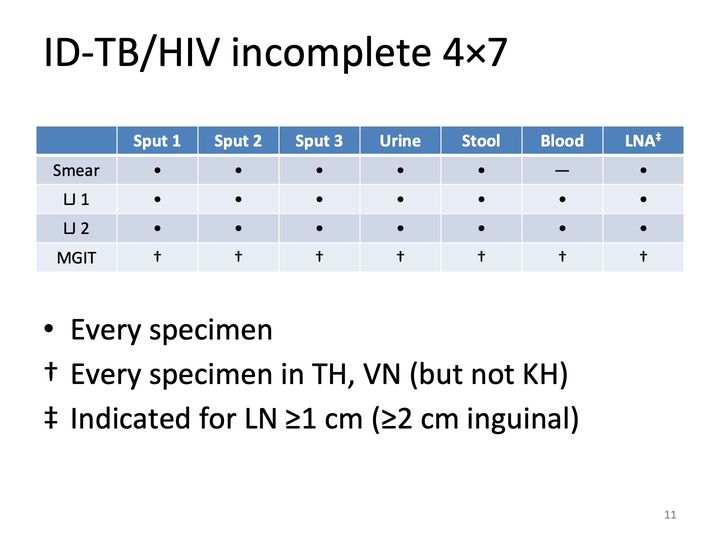
Abbreviations: HIV = human immunodeficiency virus; ID = Improving Diagnosis of TB in People Living with HIV (study); KH = Cambodia; LJ = Löwenstein–Jensen (egg-based solid culture medium for mycobacteria); LN = lymph node; LNA = lymph node aspirate; MGIT = Mycobacteria Growth Indicator Tube (liquid culture system); TB = tuberculosis; TH = Thailand; VN = Vietnam.
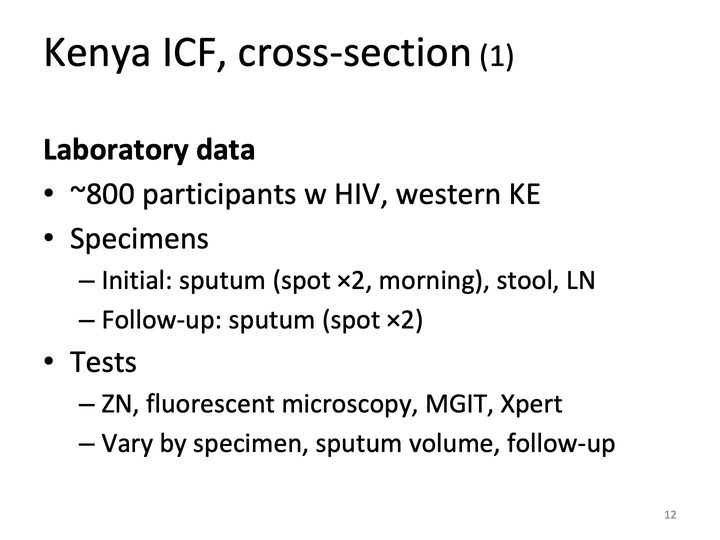
Abbreviations: HIV = human immunodeficiency virus; KE = Kenya; LN = lymph node; MGIT = Mycobacteria Growth Indicator Tube (liquid culture system); Xpert = Xpert MTB/RIF (Cepheid GeneXpert cartridge nucleic acid amplification test for TB and rifampicin resistance); ZN = Ziehl–Neelsen (acid-fast stain for smear microscopy).
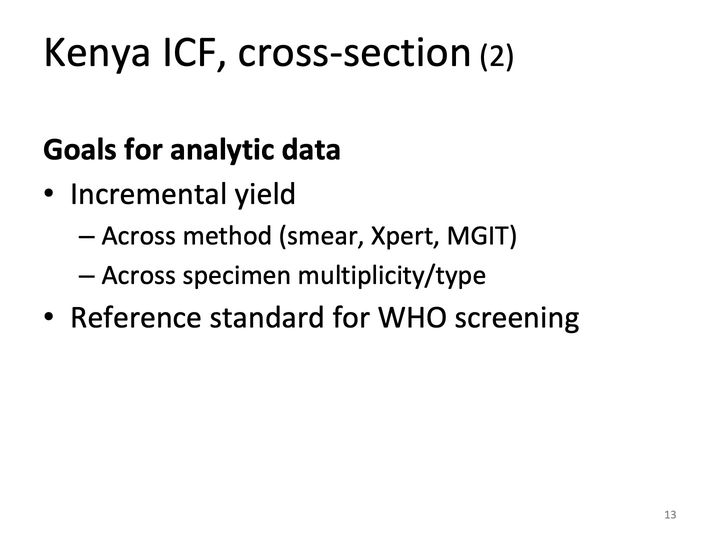
Abbreviations: MGIT = Mycobacteria Growth Indicator Tube (liquid culture system); WHO = World Health Organization; Xpert = Xpert MTB/RIF (Cepheid GeneXpert cartridge nucleic acid amplification test for TB and rifampicin resistance).
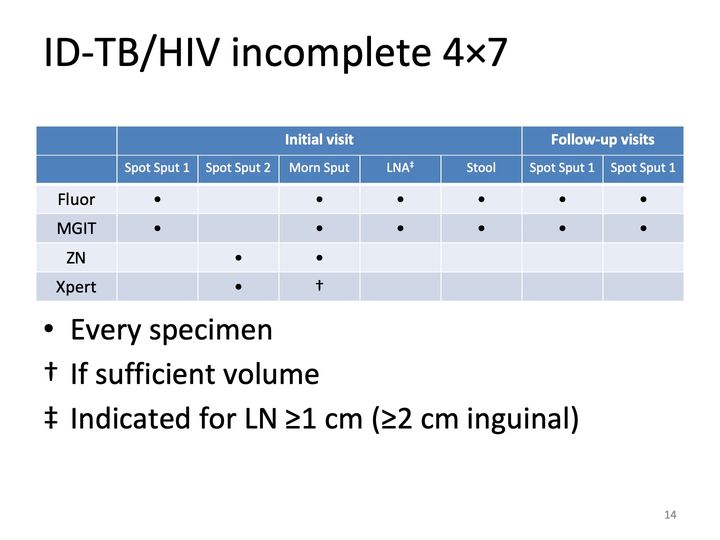
Abbreviations: ICF = intensified case finding; LN = lymph node; LNA = lymph node aspirate; MGIT = Mycobacteria Growth Indicator Tube (liquid culture system); Xpert = Xpert MTB/RIF (Cepheid GeneXpert cartridge nucleic acid amplification test for TB and rifampicin resistance); ZN = Ziehl–Neelsen (acid-fast stain for smear microscopy).
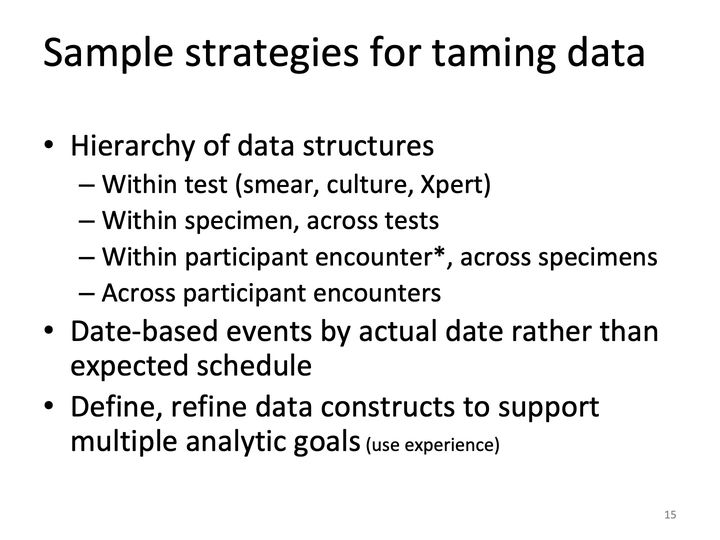
Abbreviations: Xpert = Xpert MTB/RIF (Cepheid GeneXpert cartridge nucleic acid amplification test for TB and rifampicin resistance).
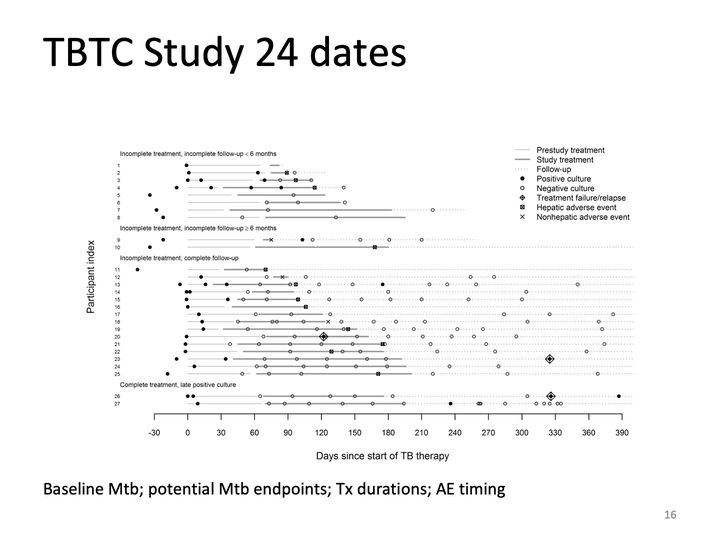
- Panels
- 1
- Elements
- 27 horizontal rows, one per participant, each made of line segments in 3 styles and point markers in 5 symbols, as the legend at upper right names them: thin light gray line, Prestudy treatment; thick gray line, Study treatment; dotted line, Follow-up; filled circle, Positive culture; open circle, Negative culture; diamond with a cross, Treatment failure/relapse; boxed x, Hepatic adverse event; x, Nonhepatic adverse event. Rows are grouped under 4 headings: "Incomplete treatment, incomplete follow-up < 6 months" (8 rows), "Incomplete treatment, incomplete follow-up ≥ 6 months" (2 rows), "Incomplete treatment, complete follow-up" (15 rows), "Complete treatment, late positive culture" (2 rows)
- Horizontal
- Days since start of TB therapy, -30 to 390, ticks every 30
- Vertical
- Participant index, 1 to 27 from top to bottom, in the 4 labeled groups; no numeric scale
- Visible pattern
- Filled circles (positive cultures) cluster at or just before day 0 in nearly every row. Thin light gray lines run from day 0 to about day 60 in most rows, and thick gray study-treatment segments begin around day 30 to 70 and end anywhere from about day 80 to 200. Hepatic adverse event markers fall between about day 70 and 175. Treatment failure/relapse diamonds appear in 3 rows, 1 near day 120 and 2 near day 325.
Text in the picture (summary)
Study participants, renumbered 1 to 27.
Abbreviations: AE = adverse event; Mtb = Mycobacterium tuberculosis (the bacterium that causes TB); TB = tuberculosis; TBTC = Tuberculosis Trials Consortium (CDC-sponsored); Tx = treatment.
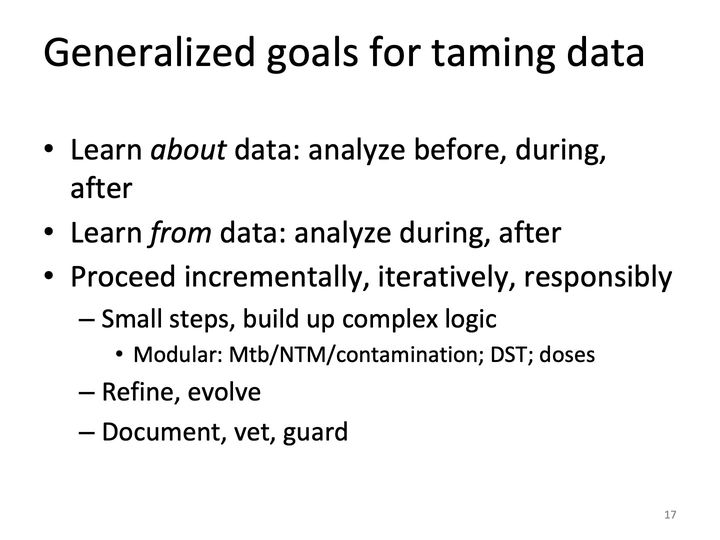
Abbreviations: DST = drug susceptibility testing; Mtb = Mycobacterium tuberculosis (the bacterium that causes TB); NTM = nontuberculous mycobacteria.
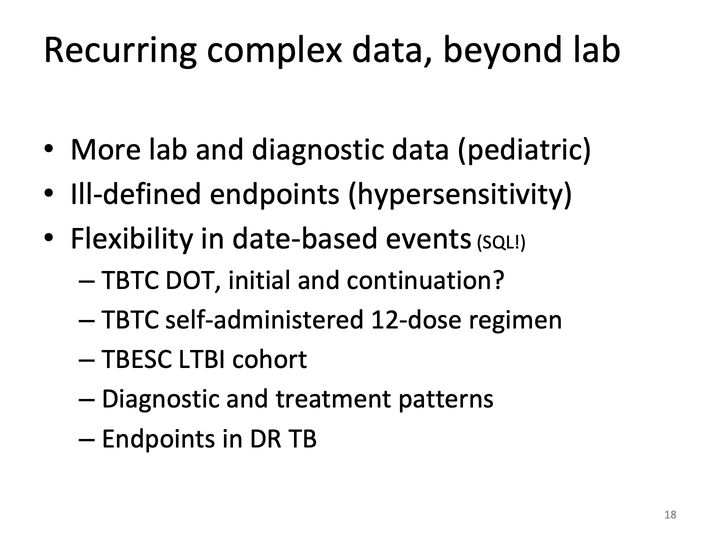
Abbreviations: DR = drug-resistant (DR TB = drug-resistant tuberculosis); LTBI = latent tuberculosis infection; SQL = Structured Query Language; TB = tuberculosis; TBESC = Tuberculosis Epidemiologic Studies Consortium (CDC); TBTC = Tuberculosis Trials Consortium (CDC-sponsored).
Text in the picture (summary)
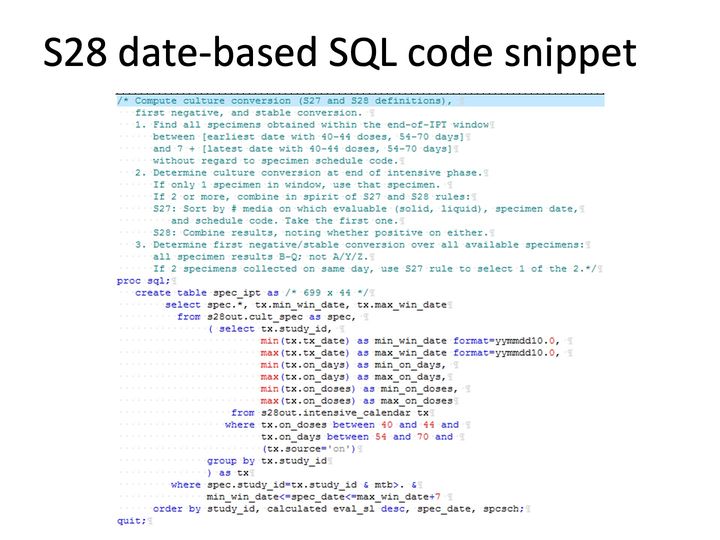
SAS/SQL code with a 15-line comment and 21-line Proc SQL Select statement to determine culture conversion and stable conversion.
Abbreviations: S28 = TBTC Study 28 (moxifloxacin vs isoniazid in the intensive phase of TB treatment); SQL = Structured Query Language.
Abbreviations
7H10 = Middlebrook 7H10 agar (solid culture medium for mycobacteria); 7H10NS = Middlebrook 7H10 agar, nonselective (without added antibiotics); 7H10S = Middlebrook 7H10 agar, selective (with added antibiotics to suppress contaminants); 7H11 = Middlebrook 7H11 agar (solid culture medium for mycobacteria); 7H11NS = Middlebrook 7H11 agar, nonselective; 7H11S = Middlebrook 7H11 agar, selective (e.g. Mitchison's selective 7H11); AE = adverse event; AFB = acid-fast bacilli; CDC = Centers for Disease Control and Prevention; CFU = colony-forming unit(s); DR = drug-resistant (DR TB = drug-resistant tuberculosis); DST = drug susceptibility testing; DTBE = Division of Tuberculosis Elimination (CDC); DTD = days to detection (time until a liquid MGIT culture signals positive); HIV = human immunodeficiency virus; HRZE = isoniazid (H), rifampin (R), pyrazinamide (Z), ethambutol (E): the standard 4-drug regimen; ICF = intensified case finding; ID = Improving Diagnosis of TB in People Living with HIV (study); KE = Kenya; KH = Cambodia; LJ = Löwenstein–Jensen (egg-based solid culture medium for mycobacteria); LN = lymph node; LNA = lymph node aspirate; LTBI = latent tuberculosis infection; MGIT = Mycobacteria Growth Indicator Tube (liquid culture system); MRZE = moxifloxacin (M), rifampin (R), pyrazinamide (Z), ethambutol (E): moxifloxacin substituted for isoniazid; Mtb = Mycobacterium tuberculosis (the bacterium that causes TB); NAA2m = TBTC Study NAA2m: a TBTC–TBRU collaborative study (Uganda, 2008–2010) of nucleic acid amplification tests and other markers of treatment response; NC = not countable; NG = no growth; NTM = nontuberculous mycobacteria; S28 = TBTC Study 28 (moxifloxacin vs isoniazid in the intensive phase of TB treatment); SQL = Structured Query Language; TB = tuberculosis; TBESC = Tuberculosis Epidemiologic Studies Consortium (CDC); TBTC = Tuberculosis Trials Consortium (CDC-sponsored); TH = Thailand; Tx = treatment; UG = Uganda; VN = Vietnam; WHO = World Health Organization; Xpert = Xpert MTB/RIF (Cepheid GeneXpert cartridge nucleic acid amplification test for TB and rifampicin resistance); ZN = Ziehl–Neelsen (acid-fast stain for smear microscopy).
References, compiled for this page
Full citations, with current links, for selected references and related works.
Full references: whole site, by domain (opens in a new tab) · whole site, by type of work (opens in a new tab)
- Cain KP, McCarthy KD, Heilig CM, Monkongdee P, Tasaneeyapan T, Kanara N, Kimerling ME, Chheng P, Thai S, Sar B, et al. An algorithm for tuberculosis screening and diagnosis in people with HIV. New England Journal of Medicine. 2010-02-25; 362(8): 707–716. (slide 14)Elsewhere on the web (opens in a new tab)
- Reves R, Heilig CM, Tapy JM, Bozeman L, Kyle RP, Hamilton CD, Bock N, Narita M, Wing D, Hershfield E, et al. Intermittent tuberculosis treatment for patients with isoniazid intolerance or drug resistance. International Journal of Tuberculosis and Lung Disease. 2014-05-01; 18(5): 571–580. (slide 16)Elsewhere on the web (opens in a new tab)
Related works, not cited
- Heilig CM, Feng P-JI, Joloba ML, Johnson JL, Morgan K, Gitta P, Boom WH, Mayanja-Kizza H, Eisenach KD, Bozeman L, Goldberg SV. How we determined the most reliable solid medium for studying treatment of tuberculosis. Tuberculosis. 2014-05; 94(3): 317–322.Elsewhere on the web (opens in a new tab)
- Joloba ML, Johnson JL, Feng P-JI, Bozeman L, Goldberg SV, Morgan K, Gitta P, Boom HW, Heilig CM, Mayanja-Kizza H, Eisenach KD. What is the most reliable solid culture medium for tuberculosis treatment trials? Tuberculosis. 2014-05; 94(3): 311–316.Elsewhere on the web (opens in a new tab)
- Mac Kenzie WR, Heilig CM, Bozeman L, Johnson JL, Muzanye G, Dunbar D, Jost KC, Diem L, Metchock B, Eisenach K, et al. Geographic differences in time to culture conversion in liquid media: Tuberculosis Trials Consortium study 28. Culture conversion is delayed in Africa. PLOS ONE. 2011-04-11; 6(4): e18358.Elsewhere on the web (opens in a new tab)