Dashes to dashes, dots to dots: fine-tuning small-data graphics in R
This rendering was constructed from an original PowerPoint presentation. Corrections of original text are indicated as “[corrected: X]”, redactions as “[redacted: X]”, and names withheld as “[generalized: X]”. Handouts and other auxiliary sources mentioned in the presentations are not available. The content of each presentation was believed to be correct and valid at the time of the presentation. This content, including references and links within the slides, has not been checked or updated when preparing this site. This rendering was facilitated by Anthropic Claude agentic tools for automated text extraction through computer vision and for assistance with compiling the completed sets.
Setting: Dashes to dashes, dots to dots: fine-tuning small-data graphics in R, 2015-10-29. CDC’s R Users Group.
The mighty dot plot met the Book of Common Prayer’s “ashes to ashes, dust to dust”. I presented 10 dot plots of 3 kinds through the lens of both the producer-writer and the consumer-reader. The producer is the first consumer, who explores data to reveal it to oneself and expresses insight to reveal it to a reader. Where Williams said, “Learning to write clearly can help us think and feel and see,” I extended that to visual narratives of data through dot plots.
I presented 3 kinds of dot plot, all generated in base R:
- Intervals [slide 7]
- Distributions [slide 15]
- Repeated measures [slide 22]
- timelines to cancer diagnosis and then to study withdrawal or death [slide 23]
- cytology results over time before and after hysterectomy [slide 26]
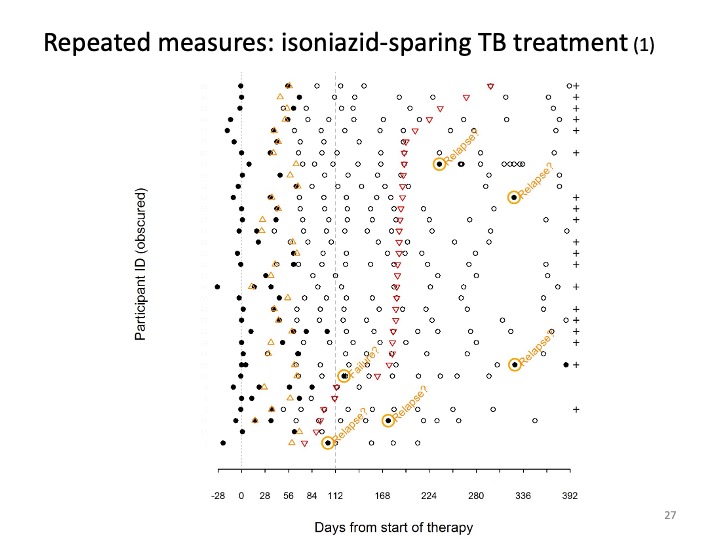
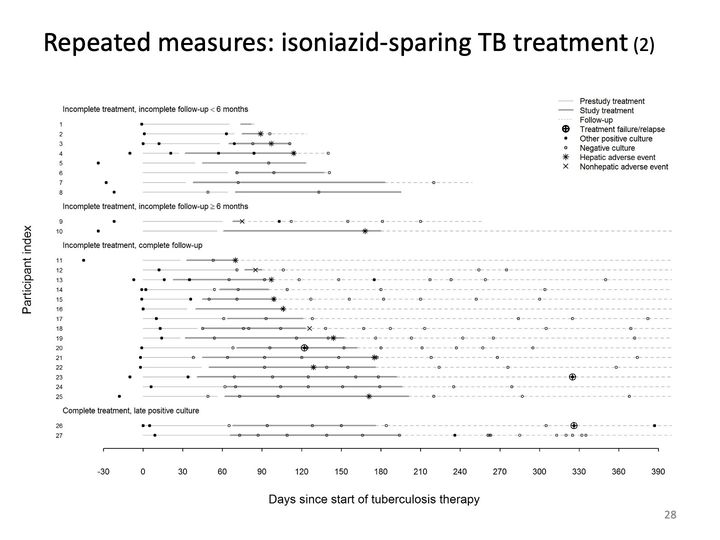
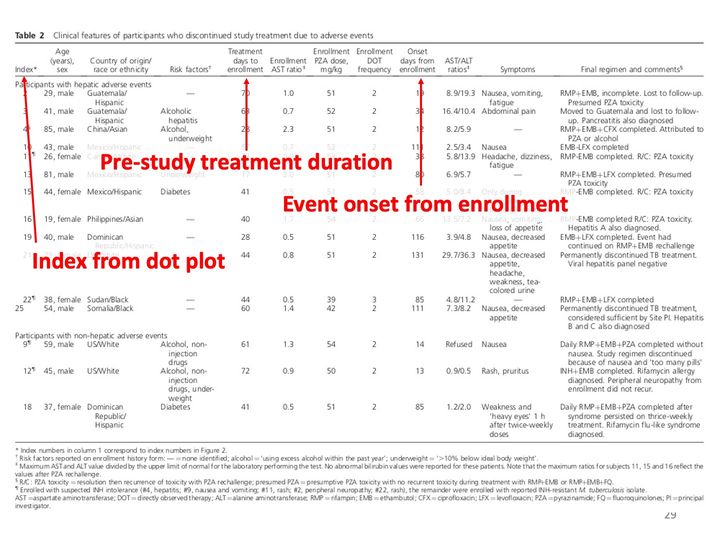
- history of mycobacterial culture results and adverse events among persons treated for TB without isoniazid [slide 27]
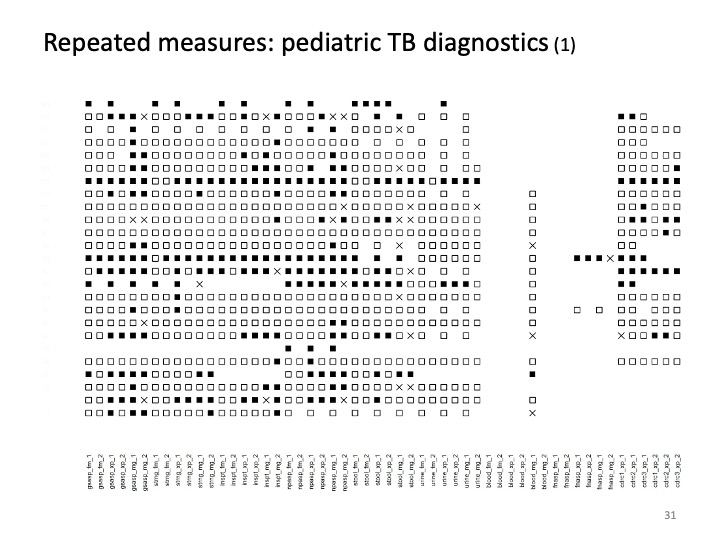
- multiple diagnostic tests and specimen types to detect TB among children [slide 31]
In many of these examples, I moved from a tabular form through multiple revisions of a dot plot, preserved and presented here to show part of the creative process.

Williams JM. Style: toward clarity and grace. University of Chicago Press, 1990. ISBN-10 0-226-89914-4.
Abbreviations: ISBN = International Standard Book Number.

Tufte ER. The visual display of quantitative information. Graphics Press, 1983. ISBN-13: 978-0961392109.
Tufte ER. Envisioning information. Graphics Press, 1990. ISBN-13: 978-0961392116.
Tufte ER. Visual explanations : images and quantities, evidence and narrative. Graphics Press, 1997. ISBN-13: 978-0961392123.
Tufte ER. Beautiful evidence. Graphics Press, 2006. ISBN-13: 978-0961392178.
Abbreviations: ISBN = International Standard Book Number.
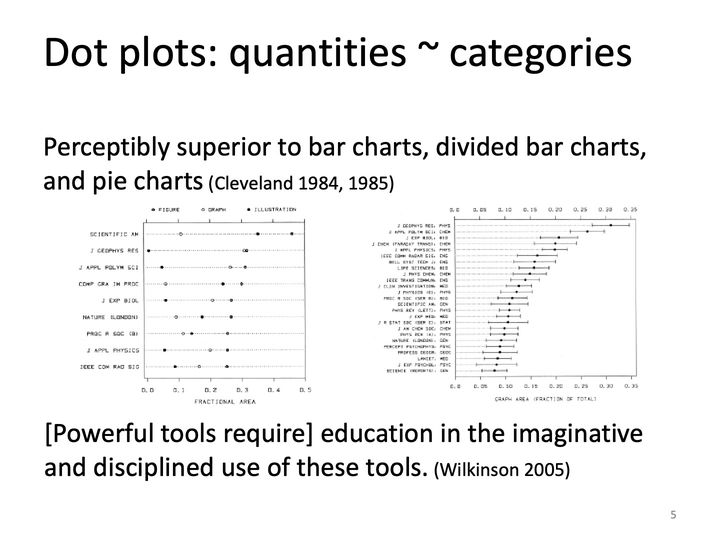
Cleveland WS. Graphical methods for data presentation: full scale breaks, dot charts, and multibased logging. The American Statistician 1984; 38(4): 270–280. DOI: 10.2307/2683401
Cleveland WS. The elements of graphing data. Wadsworth, 1985. ISBN-10: 0-534-03730-5.
Cleveland WS. Visualizing data. Hobart Press, 1993. ISBN-13: 978-0963488404.
Wickham H. A layered grammar of graphics. Journal of Computational and Graphical Statistics 2010; 19(1): 3–28. DOI: 10.1198/jcgs.2009.07098
Wilkinson L. The grammar of graphics. Springer, 2005. ISBN-13: 978-0387-24544-7.
Abbreviations: DOI = digital object identifier; ISBN = International Standard Book Number.
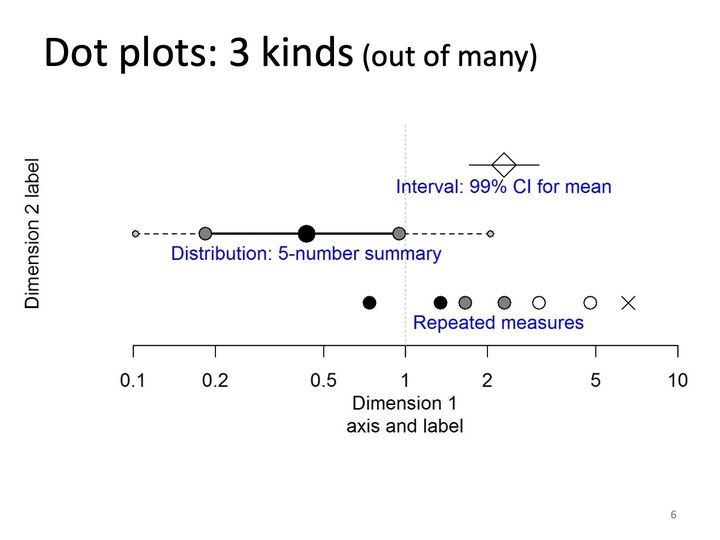
- Panels
- 1
- Elements
- 3 rows: an open diamond on a horizontal line segment; a 5-marker summary in which small gray end dots are joined by dashed lines to medium gray dots, which are joined by a thick solid line through a large black dot; and 7 separate markers (2 black filled circles, 2 gray filled circles, 2 open circles, 1 X). Each row carries a blue text label
- Horizontal
- Log scale, 0.1 to 10, labeled Dimension 1 axis and label; dotted vertical reference line at 1
- Vertical
- 3 unlabeled rows without ticks; axis title Dimension 2 label
- Visible pattern
- The interval row spans, with the diamond near 2.2. The 5-number summary spans about 0.1 to 2.1, its thick segment about 0.18 to 0.95 and its large dot near 0.45. The repeated measures spread from about 0.75 to about 7, the marker fills lightening from black through gray to open from left to right, ending in the X.
Text in the picture
Interval: 99% CI for mean
Distribution: 5-number summary
Repeated measures
Dimension 2 label
Dimension 1
axis and label
All graphics from this slide forward were produced in base R; see www.r-project.org/about.html and cran.r-project.org/web/views/Graphics.html for more information. R scripts are available for CDC use to reconstructe these graphics.
Wilkinson’s Grammar of Graphics (2005), adapted and applied to dot plots
Data operations that create variables from datasets: construct categorical variables, continuous measures
Variable transformations:
Discrete units: map categories (grouped, nested, ordered, spaced) to discrete values, such as rank for ordering of elements
Continuous measures: calculate measure(s) per discrete unit relative to reference value
Confidence intervals: lower and upper limits, summary statistics
Distributions: centiles or other summary values, such as a 5-number summary with 10th, 25th, 50th, 75th, and 90th centiles
Repeated measures (temporal): set reference value, such as index event; calculate values for other events relative to reference
Scale transformations, such as logarithm for representing quantities across orders of magnitude, like odds ratios
Coordinate system, such as Cartesian or polar
Elements, including graphs (points, lines) and their aesthetic attributes (color, size)
Guides, such as axes, legends
Other holistic considerations
Horizontal or vertical orientation for continuous measures
Spacing between units and groups
Concentration or density (~25–30 discrete values?)
Tufteisms: chartjunk, data-ink ratio, style and placement of labels
Abbreviations: CDC = Centers for Disease Control and Prevention; CI = confidence interval.
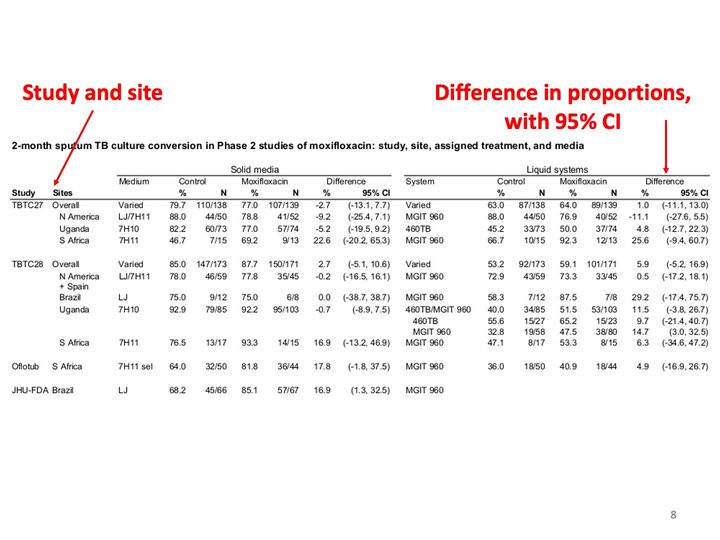
A wide table in black type fills the middle of the slide. A red arrow runs from the red label at upper left down to the Sites column heading; a second red arrow runs from the red label at upper right down to the Difference column of the right half of the table.
Text in the picture (summary)
A table of 2-month culture conversion percentages and counts for control and treatment arms, with differences and 95% confidence intervals, by study and site, for solid and liquid media.
Abbreviations: CI = confidence interval; TB = tuberculosis.
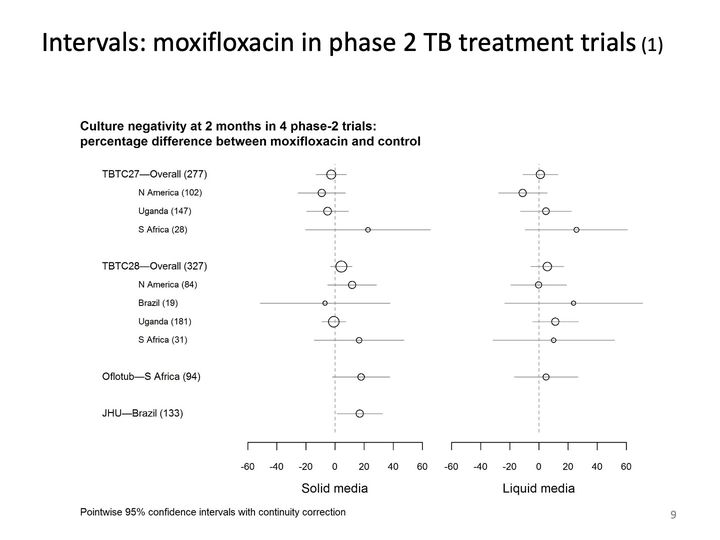
- Panels
- 2
- Elements
- Open circles with horizontal intervals: 11 in the solid media panel and 10 in the liquid media panel (the last row has none); circles vary in size, larger in rows with larger numbers in parentheses
- Horizontal
- -60 to 60 in each panel, panels labeled Solid media and Liquid media; dashed vertical reference line at 0
- Vertical
- 11 rows in 4 groups: an overall row with 3 site rows, an overall row with 4 site rows, and 2 single rows; site rows indented
- Visible pattern
- In both panels most intervals cross the dashed line at 0, and the points lie between about -12 and 25. The overall rows have the narrowest intervals, about 20 points wide; site rows with small numbers in parentheses have the widest, reaching about 90 points. In the solid media panel the last row's interval lies just to the right of 0. Points in the liquid panel sit at or right of 0 more often than in the solid panel.
Text in the picture
Culture negativity at 2 months in 4 phase-2 trials:
percentage difference between moxifloxacin and control
TBTC27—Overall (277)
N America (102)
Uganda (147)
S Africa (28)
TBTC28—Overall (327)
N America (84)
Brazil (19)
Uganda (181)
S Africa (31)
Oflotub—S Africa (94)
JHU—Brazil (133)
Pointwise 95% confidence intervals with continuity correction
Burman WJ et al. Moxifloxacin versus ethambutol in the first 2 months of treatment for pulmonary tuberculosis. American Journal of Respiratory and Critical Care Medicine 2006; 174(3): 331–338. DOI: 10.1164/rccm.200603-360OC
Conde MB. Moxifloxacin versus ethambutol in the initial treatment of tuberculosis: a double-blind, randomised, controlled phase II trial. The Lancet 2009; 373(9670): 1183–1189. DOI: 10.1016/S0140-6736(09)60333-0
Dorman SE et al. Substitution of moxifloxacin for isoniazid during intensive phase treatment of pulmonary tuberculosis. American Journal of Respiratory and Critical Care Medicine 2009; 180(3): 273–280. DOI: 10.1164/rccm.200901-0078OC
Rustomjee R et al. A phase II study of the sterilising activities of ofloxacin, gatifloxacin and moxifloxacin in pulmonary tuberculosis. The International Journal of Tuberculosis and Lung Disease 2008; 12(2): 128–138.
Abbreviations: DOI = digital object identifier; JHU = Johns Hopkins University; TB = tuberculosis; TBTC27 = Tuberculosis Trials Consortium Study 27; TBTC28 = Tuberculosis Trials Consortium Study 28.
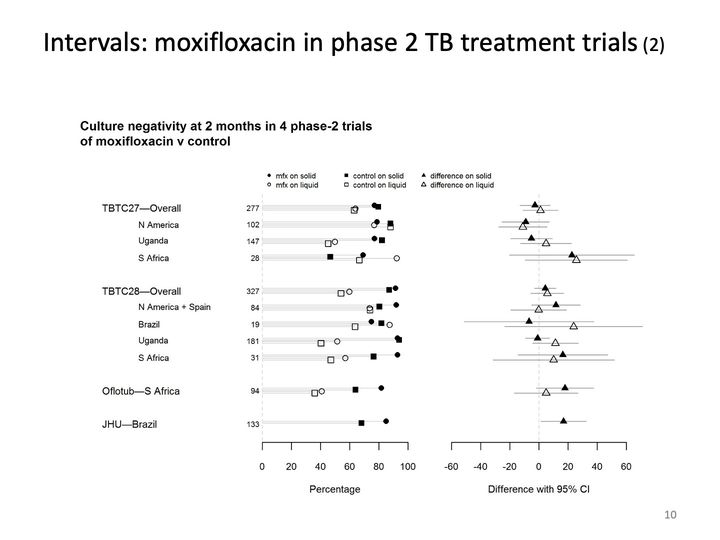
- Panels
- 2
- Elements
- Left panel: per row up to 4 markers (filled circle, filled square, open circle, open square, per the legend), 42 in all (the last row has only the 2 filled markers), each joined to 0 by a light gray horizontal line; row sizes printed between labels and panel. Right panel: per row a filled and an open triangle with horizontal intervals, 21 in all (the last row has only the filled triangle)
- Horizontal
- Left panel: Percentage, 0 to 100, -60 to 60, dashed vertical reference line at 0
- Vertical
- 11 rows in 4 groups, as on the previous slide, with site rows indented
- Visible pattern
- In the left panel the filled (solid medium) markers cluster mostly between about 65 and 95, while the open (liquid) markers spread more widely, from about 35 to 95. In the right panel each row's pair of triangles lies near or across 0, with points between about -12 and 25; the intervals are narrowest for the overall rows and widest for rows with small sizes, reaching from about -50 to beyond 60.
Text in the picture
Culture negativity at 2 months in 4 phase-2 trials
of moxifloxacin v control
mfx on solid
control on solid
difference on solid
mfx on liquid
control on liquid
difference on liquid
TBTC27—Overall 277
N America 102
Uganda 147
S Africa 28
TBTC28—Overall 327
N America + Spain 84
Brazil 19
Uganda 181
S Africa 31
Oflotub—S Africa 94
JHU—Brazil 133
Abbreviations: JHU = Johns Hopkins University; TB = tuberculosis; TBTC27 = Tuberculosis Trials Consortium Study 27; TBTC28 = Tuberculosis Trials Consortium Study 28.
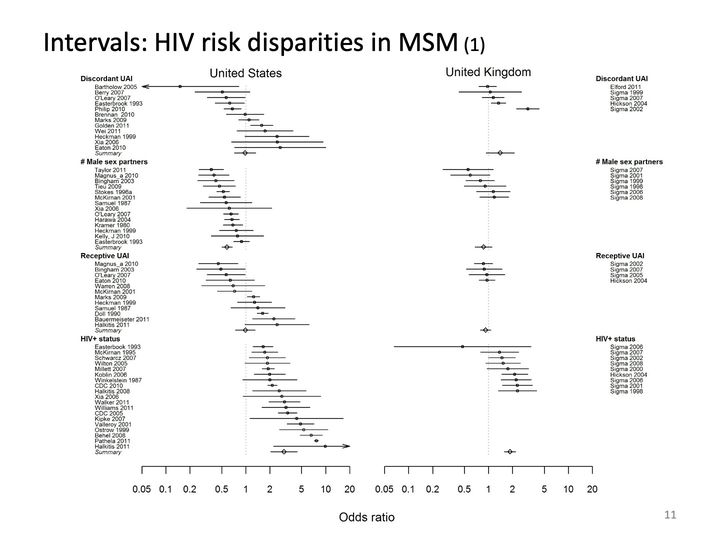
- Panels
- 2, titled United States and United Kingdom
- Elements
- Small squares with horizontal intervals, about 57 in the United States panel and 24 in the United Kingdom panel; 4 open diamonds with intervals in each panel mark summary rows; 2 intervals in the United States panel end in arrows beyond the axis, one at each end
- Horizontal
- Log scale, 0.05 to 20 in each panel, shared label Odds ratio; dotted vertical reference line at 1
- Vertical
- 4 labeled groups in each panel: Discordant UAI, # Male sex partners, Receptive UAI, HIV+ status, each a list of study rows; the United States groups end in a row labeled Summary; group labels repeated at right for the United Kingdom panel
- Visible pattern
- In the United States panel the rows within each group are ordered by increasing point estimate, so each group slants from upper left to lower right. Discordant UAI spans about 0.15 to 2.7 and Receptive UAI about 0.45 to 2.5, both with summaries near 1; # Male sex partners lies entirely below 1, about 0.35 to 0.85, with summary near 0.6; HIV+ status lies entirely above 1, about 1.6 to 10, with summary near 3. In the United Kingdom panel the groups are shorter and closer to 1: # Male sex partners and Receptive UAI cluster between about 0.55 and 1.2, Discordant UAI between about 1 and 3, and HIV+ status mostly between about 1.4 and 2.3, with one row near 0.45 on a very wide interval.
Text in the picture (summary)
Row labels name the studies in each group by first author or survey name and year.
Millett GA, Peterson JL, Flores SA, Hart TA, Jeffries WL, Wilson PA, Rourke SB, Heilig CM, Elford JE, Fenton KA, Remis RS. Comparisons of disparities and risks of HIV infection in black and other men who have sex with men in Canada, UK, and USA: a meta-analysis. Lancet 2012; 380: 341–348. DOI: 10.1016/s0140-6736(12)60899-x.
Abbreviations: DOI = digital object identifier; HIV = human immunodeficiency virus; HIV+ = HIV-positive; MSM = men who have sex with men; UAI = unprotected anal intercourse; UK = United Kingdom; USA = United States of America.
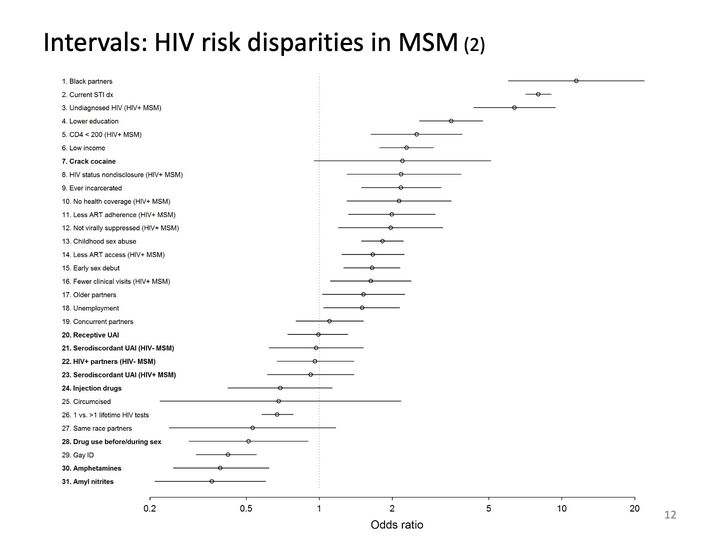
- Panels
- 1
- Elements
- 31 open circles with horizontal intervals
- Horizontal
- Log scale, 0.2 to 20, labeled Odds ratio; dotted vertical reference line at 1
- Vertical
- 31 numbered categories, listed top to bottom
- Visible pattern
- The circles descend steadily from about 12 at the top to about 0.37 at the bottom, forming a band slanting from upper right to lower left. Interval widths vary a great deal, from very short to spanning a factor of 10.
Text in the picture
1. Black partners
2. Current STI dx
3. Undiagnosed HIV (HIV+ MSM)
4. Lower education
5. CD4 < 200 (HIV+ MSM)
6. Low income
7. Crack cocaine
8. HIV status nondisclosure (HIV+ MSM)
9. Ever incarcerated
10. No health coverage (HIV+ MSM)
11. Less ART adherence (HIV+ MSM)
12. Not virally suppressed (HIV+ MSM)
13. Childhood sex abuse
14. Less ART access (HIV+ MSM)
15. Early sex debut
16. Fewer clinical visits (HIV+ MSM)
17. Older partners
18. Unemployment
19. Concurrent partners
20. Receptive UAI
21. Serodiscordant UAI (HIV- MSM)
22. HIV+ partners (HIV- MSM)
23. Serodiscordant UAI (HIV+ MSM)
24. Injection drugs
25. Circumcised
26. 1 vs. >1 lifetime HIV tests
27. Same race partners
28. Drug use before/during sex
29. Gay ID
30. Amphetamines
31. Amyl nitrites
Odds ratio
Abbreviations: ART = antiretroviral therapy; CD4 = cluster of differentiation 4; HIV = human immunodeficiency virus; HIV+ = HIV-positive; MSM = men who have sex with men; STI = sexually transmitted infection; UAI = unprotected anal intercourse.
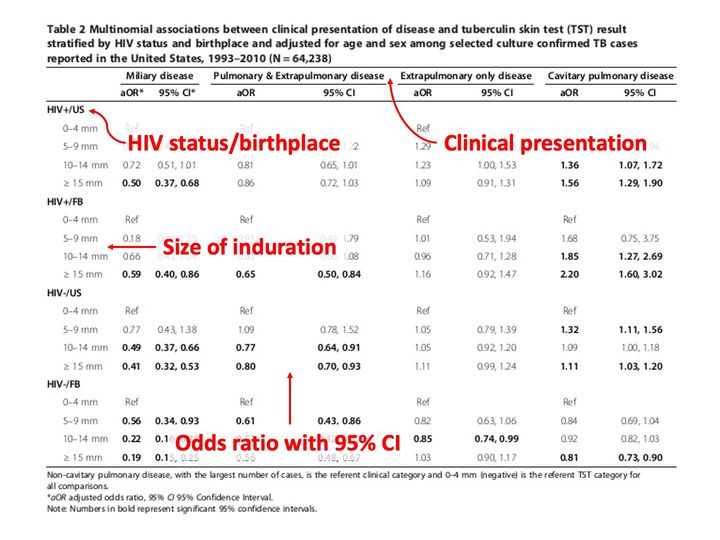
A table fills the slide, with a caption above and footnotes below. Four large red labels with red arrows are laid over it.
Text in the picture (summary)
A table of adjusted odds ratios with 95% confidence intervals for four clinical presentations, by skin-test induration size within four HIV status and birthplace groups.
Abbreviations: CI = confidence interval; HIV = human immunodeficiency virus; TB = tuberculosis; TST = tuberculin skin test.
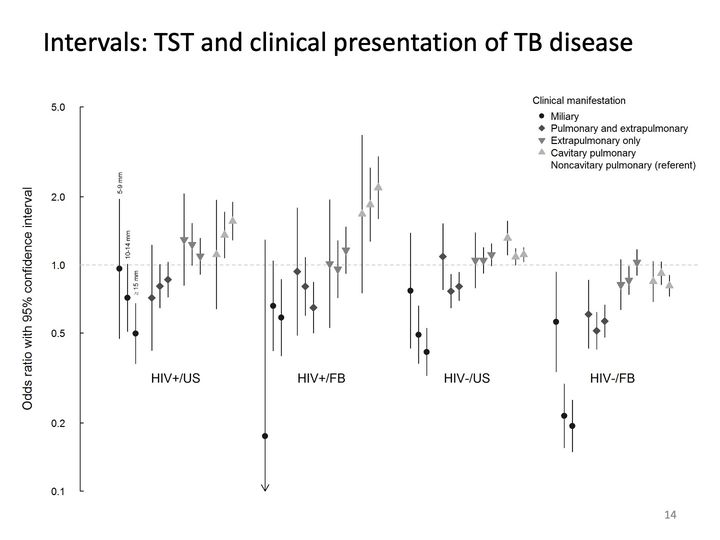
- Panels
- 1
- Elements
- 48 markers with vertical intervals: 4 groups, each with 4 clusters of 3 markers; marker shape and shade by clinical manifestation per the legend (black circles, dark diamonds, gray downward triangles, light upward triangles); the 3 markers in a cluster correspond to 3 induration sizes
- Horizontal
- 4 categories: HIV+/US, HIV+/FB, HIV-/US, HIV-/FB
- Vertical
- Log scale, 0.1 to 5.0, labeled Odds ratio with 95% confidence interval; dashed horizontal reference line at 1.0
- Visible pattern
- Miliary markers (black circles) lie at or below 1 in every group. Cavitary pulmonary markers (light triangles) lie above 1 in the first 3 groups. Extrapulmonary-only markers stay between about 0.8 and 1.3, and pulmonary and extrapulmonary diamonds lie below 1 except one near 1.1 in HIV-/US.
Text in the picture
Clinical manifestation
Miliary
Pulmonary and extrapulmonary
Extrapulmonary only
Cavitary pulmonary
Noncavitary pulmonary (referent)
5-9 mm
10-14 mm
≥ 15 mm
Auld SC, Click ES, Heilig CM, Miramontes R, Cain KP, Bisson GP, Mac Kenzie WR. Association between tuberculin skin test result and clinical presentation of tuberculosis disease. BMC Infectious Diseases 2013; 13: 460. DOI: 10.1186/1471-2334-13-460.
Abbreviations: DOI = digital object identifier; FB = foreign-born; HIV = human immunodeficiency virus; HIV+ = HIV-positive; TB = tuberculosis; TST = tuberculin skin test; US = United States.
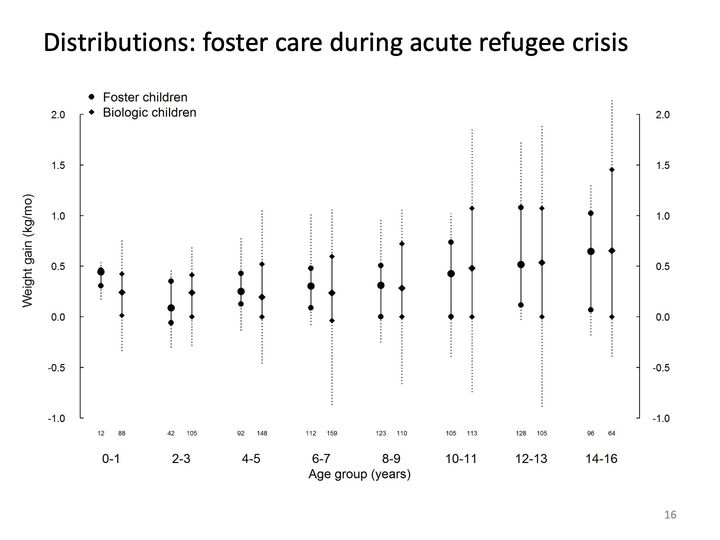
- Panels
- 1
- Elements
- 16 vertical summaries, 2 per age group (circles for foster children, diamonds for biologic children, per the legend): each a large central marker on a solid segment between 2 small markers, with dotted lines extending beyond; number per subgroup printed beneath each summary
- Horizontal
- 8 categories, Age group (years): 0-1, 2-3, 4-5, 6-7, 8-9, 10-11, 12-13, 14-16
- Vertical
- Weight gain (kg/mo), -1.0 to 2.0, scale repeated on left and right
- Visible pattern
- The central markers rise from about 0.1 to 0.45 in the youngest groups to about 0.65 in the oldest. The spreads widen with age: in the youngest groups the dotted extents stay within about -0.35 to 0.75, while in the older groups they reach from about -0.9 to about 2.1. In many groups the lower small marker sits at 0.0. From age 4-5 on, the foster and biologic central markers in each group sit close together, the biologic summaries usually spreading wider.
Text in the picture
Foster children
Biologic children
12 88 42 105 92 148 112 159 123 110 105 113 128 105 96 64
Duerr A, Posner SF, Gilbert M. Evidence in support of foster care during acute refugee crises. American Journal of Public Health 2003; 93(11): 1904–1909. DOI: 10.2105/AJPH.93.11.1904.
Abbreviations: DOI = digital object identifier.
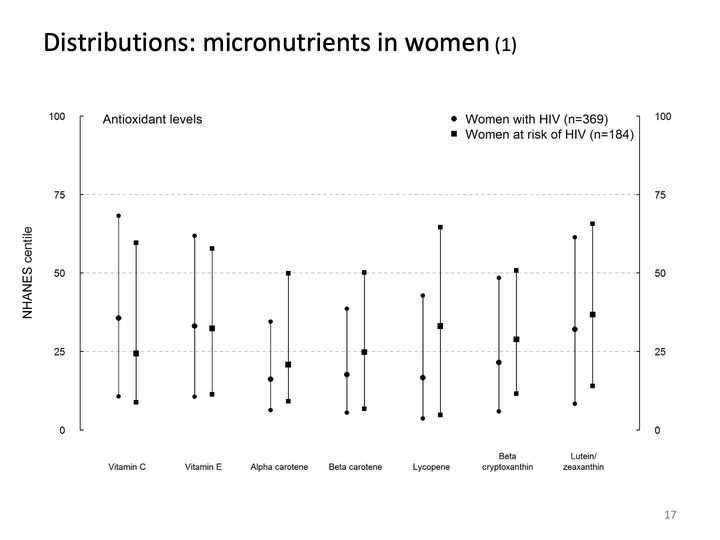
- Panels
- 1
- Elements
- 7 pairs of vertical lines, each line with a large central marker and small end markers; circles for women with HIV (n=369), squares for women at risk of HIV (n=184), per the legend
- Horizontal
- 7 categories: Vitamin C, Vitamin E, Alpha carotene, Beta carotene, Lycopene, Beta cryptoxanthin, Lutein/zeaxanthin, each with a circle line on the left and a square line on the right
- Vertical
- NHANES centile, 0 to 100, labeled on both left and right axes; dashed gray reference lines at 25, 50 and 75; data extend from about 4 to 68, where the panel label and legend sit
- Visible pattern
- All 14 lines sit in the lower 2-thirds of the scale: lower ends fall between about 4 and 14, upper ends between about 34 and 68. The central markers lie between about 16 and 37, below the 50 line throughout. The 2 vitamin pairs on the left have the highest circle centers and the tallest circle lines; across the 5 categories to the right, the square line reaches higher than the circle line, and its central marker sits higher.
Text in the picture
Antioxidant levels
Women with HIV (n=369)
Women at risk of HIV (n=184)
NHANES centile
Tohill BC, Heilig CM, Klein RS, Rompalo A, Cu-Uvin S, Piwoz E, Jamieson DJ, and Duerr A. Nutritional biomarkers associated with gynecological conditions among U.S. women with or at risk of HIV infection. American Journal of Clinical Nutrition 2007; 85: 1327–1334.
Abbreviations: HIV = human immunodeficiency virus; NHANES = National Health and Nutrition Examination Survey.
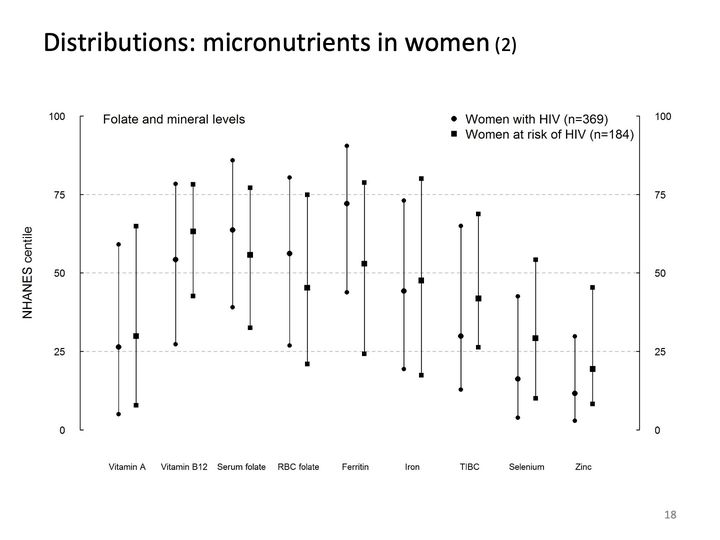
- Panels
- 1
- Elements
- 9 pairs of vertical lines, each line with a large central marker and small end markers; circles for women with HIV (n=369), squares for women at risk of HIV (n=184), per the legend
- Horizontal
- 9 categories: Vitamin A, Vitamin B12, Serum folate, RBC folate, Ferritin, Iron, TIBC, Selenium, Zinc, each with a circle line on the left and a square line on the right
- Vertical
- NHANES centile, 0 to 100, labeled on both left and right axes; dashed gray reference lines at 25, 50 and 75; data extend from about 3 to 90
- Visible pattern
- The lines are long,, and together they cover nearly the whole scale, from about 3 to 90. The central markers form a rough arch across the categories: low for Vitamin A (about 26 to 30), high from Vitamin B12 through Ferritin (about 45 to 72, the Ferritin circle highest), then falling through Iron and TIBC to the lowest values for Selenium and Zinc (about 12 to 29). Within pairs the circle and square lines overlap widely.
Text in the picture
Folate and mineral levels
Women with HIV (n=369)
Women at risk of HIV (n=184)
NHANES centile
Abbreviations: HIV = human immunodeficiency virus; NHANES = National Health and Nutrition Examination Survey; RBC = red blood cell; TIBC = total iron-binding capacity.
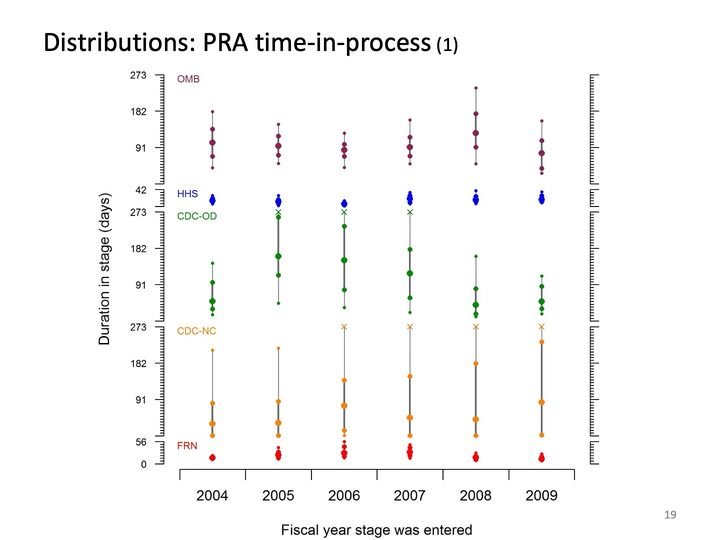
- Panels
- 5 stacked bands of different heights, sharing one horizontal axis, each with its own vertical scale
- Elements
- in each band, 6 vertical summaries, one per fiscal year: a gray vertical line, thicker in its middle part, carrying dots of 3 sizes (largest near the middle, smallest at the ends); in some years an x at the top of the band. Colors by band: OMB maroon, HHS blue, CDC-OD green, CDC-NC orange, FRN red; HHS and FRN summaries are compact clusters of dots
- Horizontal
- Fiscal year stage was entered, 6 categories, 2004 to 2009
- Vertical
- Duration in stage (days), labeled on the left only, with an unlabelled mirrored tick axis on the right. OMB, CDC-OD and CDC-NC bands each have ticks labeled 91, 182 and 273 (273 at the band top); the narrow HHS band is labeled 42 at its top; the narrow FRN band is labeled 56 at its top and 0 at its bottom; other band bottoms are unlabelled
- Visible pattern
- OMB summaries are similar from year to year, centered near 91 days. HHS clusters sit tightly every year, and FRN clusters sit tightly near the bottom of theirs. CDC-OD centers are low in 2004, high in 2005 to 2007, and low again in 2008 and 2009. CDC-NC centers stay low while the lines stretch upward, to about 210 in 2004 and 2005 and to the x at the band top from 2006 to 2009.
Text in the picture
OMB
HHS
CDC-OD
CDC-NC
FRN
Duration in stage (days)
Fiscal year stage was entered
Heilig CM, Lee LM. Unpublished data and graphic.
Abbreviations: CDC = Centers for Disease Control and Prevention; FRN = Federal Register notice; HHS = Department of Health and Human Services; NC = not countable; OD = Office of the Director; OMB = Office of Management and Budget; PRA = Paperwork Reduction Act (as in the OMB information-collection clearance process).
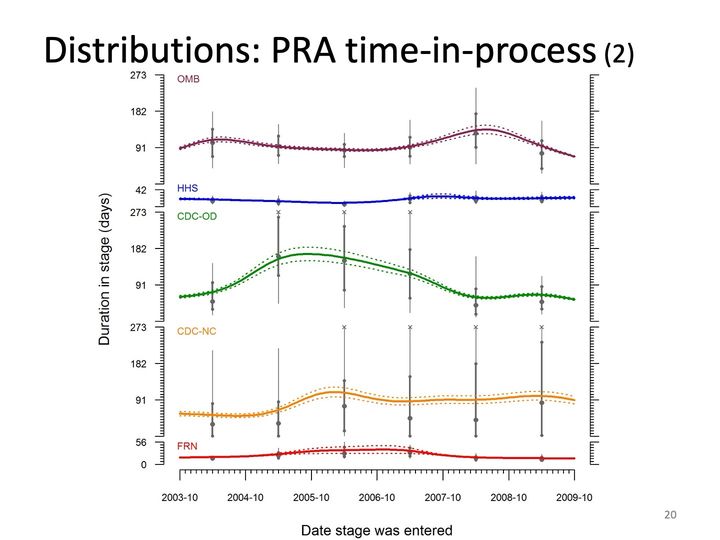
- Panels
- 5 stacked bands of different heights, sharing one horizontal axis, each with its own vertical scale
- Elements
- in each band, a solid colored curve between 2 dotted curves of the same color, over 6 gray vertical summaries (line with dots of 3 sizes) placed about midway through each year, and gray x marks at the band top in some years. Colors by band: OMB maroon, HHS blue, CDC-OD green, CDC-NC orange, FRN red
- Horizontal
- Date stage was entered, 2003-10 to 2009-10, labels yearly, minor ticks monthly
- Vertical
- Duration in stage (days), same scales as the previous slide: OMB, CDC-OD and CDC-NC bands labeled 91, 182, 273; HHS labeled 42 at its top; FRN labeled 56 at its top and 0 at its bottom; unlabelled mirrored tick axis on the right
- Visible pattern
- The OMB curve runs near 90 to 110 days, rises to a peak of about 140 in mid-2008 and falls to about 75 by 2009-10. The HHS curve is nearly flat. The CDC-OD curve rises from about 65 in late 2003 to a broad peak of about 165 near 2005-10, declines to about 65 by early 2008 and stays low. The CDC-NC curve, rises to about 110 around 2006-04 and then holds near 90 to 100. The FRN curve stays low and nearly flat, with a slight rise from 2005 to 2007. The dotted curves stay close to the solid ones, separating most around the peaks.
Text in the picture
OMB
HHS
CDC-OD
CDC-NC
FRN
Duration in stage (days)
Date stage was entered
Abbreviations: CDC = Centers for Disease Control and Prevention; FRN = Federal Register notice; HHS = Department of Health and Human Services; NC = not countable; OD = Office of the Director; OMB = Office of Management and Budget; PRA = Paperwork Reduction Act (as in the OMB information-collection clearance process).
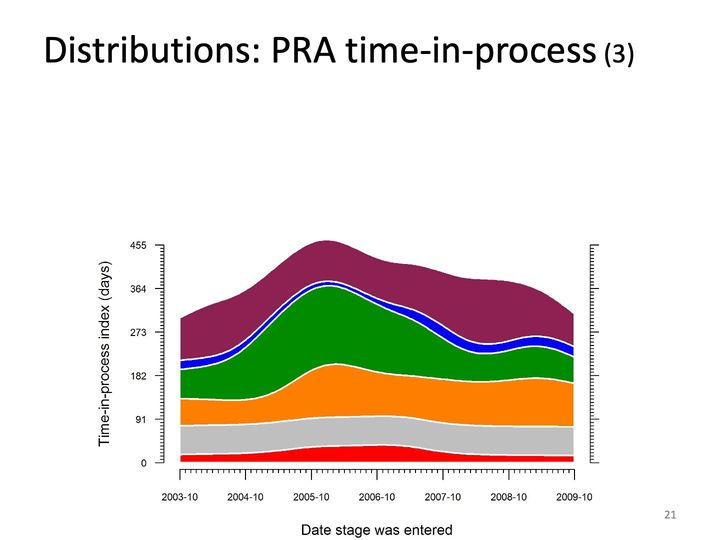
- Panels
- 1
- Elements
- 6 stacked smooth bands, top to bottom maroon, blue, green, orange, gray and red, separated by thin white lines; no labels or legend
- Horizontal
- Date stage was entered, 2003-10 to 2009-10, labels yearly, minor ticks monthly
- Vertical
- Time-in-process index (days), 0 to 455, ticks labeled 0, 91, 182, 273, 364, 455; unlabelled mirrored tick axis on the right; the stack reaches the top of the scale at its peak
- Visible pattern
- The top edge of the stack starts near 300 at 2003-10, climbs to a peak near 455 around early 2006, eases to about 380 through 2007 and 2008, and falls to about 310 at 2009-10. The green band changes most: thin (about 60) in 2003, widest (about 160) around 2006, and narrowing to about 60 by late 2008. The orange band widens from about 55 to about 110 around 2005-10 and stays wide. The red, gray and blue bands stay thin and nearly constant, and the maroon top band is about 80 to 140 thick,.
Abbreviations: PRA = Paperwork Reduction Act (as in the OMB information-collection clearance process).
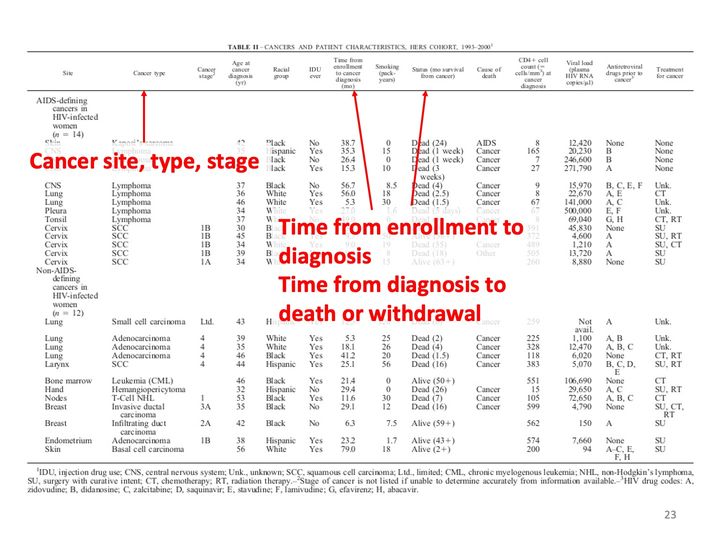
A wide typeset table fills the slide. Three red arrows run from the overlaid red labels up to column headings: one to the cancer type heading, one to the time from enrollment to cancer diagnosis heading, and one to the survival status heading. The table rows behind the red labels are faded.
Text in the picture (summary)
A typeset table listing cancer site, type, stage, timing, treatment and outcome for each of 26 women with HIV, in two groups of 14 and 12.
Abbreviations: HIV = human immunodeficiency virus.
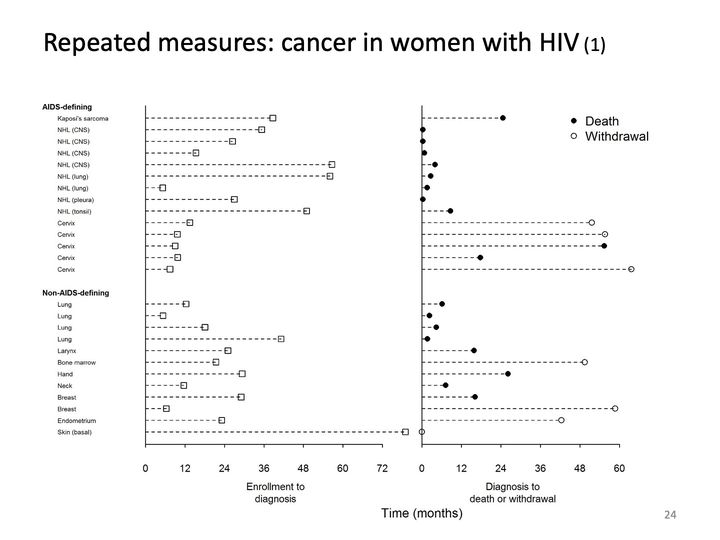
- Panels
- 2, side by side, sharing row labels
- Elements
- left panel: 26 dashed lines from 0, each ending in an open square; right panel: 26 dashed lines from 0, each ending in a filled circle (Death) or open circle (Withdrawal), 19 filled and 7 open
- Horizontal
- left: Enrollment to diagnosis, 0 to 72 months, ticks every 12, one square beyond the axis end near 78; right: Diagnosis to death or withdrawal, 0 to 60 months, ticks every 12; shared title Time (months)
- Vertical
- 26 rows in 2 labeled groups: AIDS-defining (14 rows) and Non-AIDS-defining (12 rows), each row labeled by cancer site or type
- Visible pattern
- In the left panel the dashed lines range from about 5 to 78 months; the 5 cervix rows are all short (about 7 to 15). In the right panel, the NHL rows end in deaths within about 9 months of diagnosis, several at or near 0, and the 4 lung rows also end in deaths within about 7 months. Withdrawals (open circles) fall late, mostly between about 42 and 64 months, except one at 0 in the last row.
Text in the picture
AIDS-defining
Kaposi's sarcoma
NHL (CNS)
NHL (CNS)
NHL (CNS)
NHL (CNS)
NHL (lung)
NHL (lung)
NHL (pleura)
NHL (tonsil)
Cervix
Cervix
Cervix
Cervix
Cervix
Non-AIDS-defining
Lung
Lung
Lung
Lung
Larynx
Bone marrow
Hand
Neck
Breast
Breast
Endometrium
Skin (basal)
Death
Withdrawal
Enrollment to
diagnosis
Diagnosis to
death or withdrawal
Time (months)
Phelps RM, Smith DK, Heilig CM, Gardner LI, Carpenter CC, Klein RS, Jamieson DJ, Vlahov D, Schuman P, Holmberg SD, HER Study Group. Cancer incidence in women with or at risk for HIV. International Journal of Cancer 2001; 94(5): 753–757. DOI: 10.1002/ijc.1528.
Abbreviations: AIDS = acquired immunodeficiency syndrome; CNS = central nervous system; DOI = digital object identifier; HER/HERS = HIV Epidemiology Research (HER) Study; HIV = human immunodeficiency virus; NHL = non-Hodgkin lymphoma.
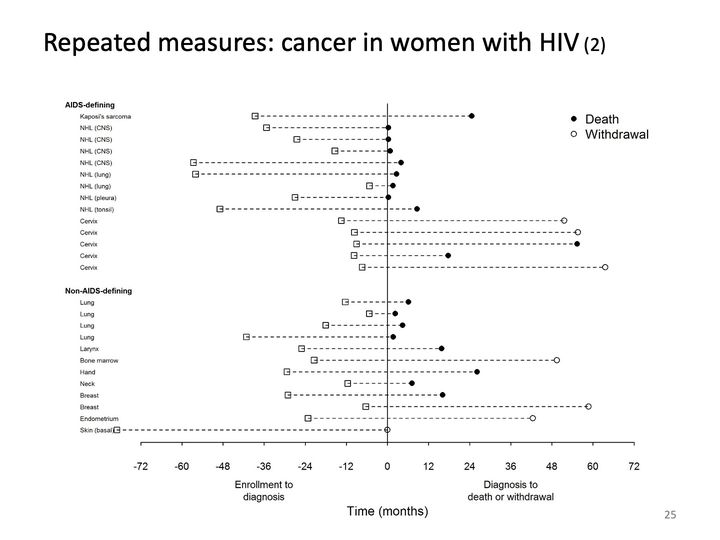
- Panels
- 1
- Elements
- 26 dashed lines, each running from an open square at negative time through 0 to a filled circle (Death) or open circle (Withdrawal) at positive time; 19 filled, 7 open; solid vertical line at 0
- Horizontal
- Time (months), -72 to 72, ticks every 12; the left half labeled Enrollment to diagnosis, the right half Diagnosis to death or withdrawal; one square beyond the left axis end near -79
- Vertical
- 26 rows in 2 labeled groups: AIDS-defining (14 rows) and Non-AIDS-defining (12 rows), each row labeled by cancer site or type
- Visible pattern
- Squares spread from about -5 to -79 months, the 5 cervix rows clustered close to 0 (about -7 to -15). To the right of 0, the NHL and lung rows stop short, with deaths within about 9 months, while the cervix rows and several non-AIDS-defining rows stretch far right, to withdrawals between about 42 and 64 months. The last row ends in a withdrawal at 0 after the longest leftward line.
Text in the picture
AIDS-defining
Kaposi's sarcoma
NHL (CNS)
NHL (CNS)
NHL (CNS)
NHL (CNS)
NHL (lung)
NHL (lung)
NHL (pleura)
NHL (tonsil)
Cervix
Cervix
Cervix
Cervix
Cervix
Non-AIDS-defining
Lung
Lung
Lung
Lung
Larynx
Bone marrow
Hand
Neck
Breast
Breast
Endometrium
Skin (basal)
Death
Withdrawal
Enrollment to
diagnosis
Diagnosis to
death or withdrawal
Time (months)
Abbreviations: AIDS = acquired immunodeficiency syndrome; CNS = central nervous system; HIV = human immunodeficiency virus; NHL = non-Hodgkin lymphoma.
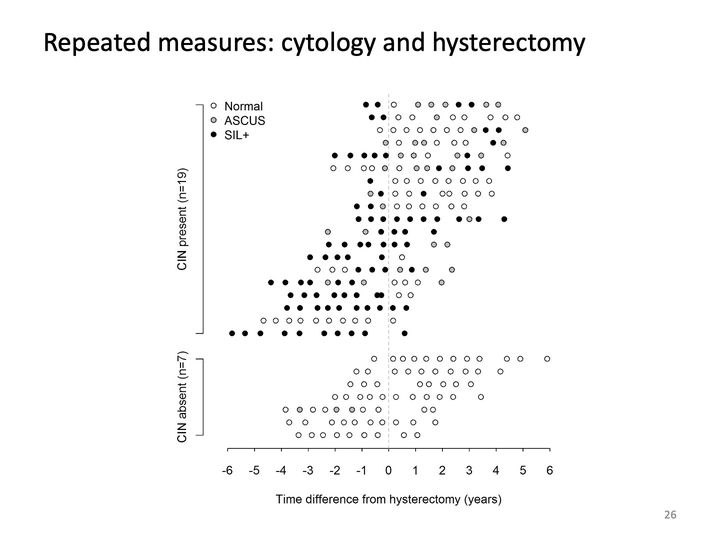
- Panels
- 1
- Elements
- circles in 3 fills on 26 rows: open (Normal), gray (ASCUS), black (SIL+), per the legend; dashed gray vertical reference line at 0
- Horizontal
- Time difference from hysterectomy (years), -6 to 6, ticks every year; data from about -5.8 to 5.9; dashed vertical guide at 0
- Vertical
- 26 unlabeled rows in 2 bracketed groups, 19 above and 7 below, group labels rotated; legend inside the upper left
- Visible pattern
- In the upper group (CIN present), the rows shift leftward going down: the top rows run from about -1 to 5 years and the bottom rows from about -6 to about 0.5. In that group black and gray dots are dense to the left of zero, though some upper rows have black and gray dots out to about 4 years. In the lower group the rows together span about -4 to 6 years and nearly every dot is white, with a few gray dots in one row between about -3.5 and -1.5.
Text in the picture
Normal
ASCUS
SIL+
CIN present (n=19)
CIN absent (n=7)
Time difference from hysterectomy (years)
Paramsothy P, Duerr A, Heilig CM, Cu-Uvin S, Anderson JR, Schuman P, Klein RS. Abnormal vaginal cytology in HIV-infected and at-risk women after hysterectomy. J Acquir Immune Defic Syndr 2004; 35: 484–491. DOI: 10.1097/00126334-200404150-00006.
Abbreviations: CIN = cervical intraepithelial neoplasia; DOI = digital object identifier; HIV = human immunodeficiency virus; SIL+ = squamous intraepithelial lesion.
- Panels
- 1
- Elements
- 33 rows of point markers, one row per participant, without connecting lines: filled black circles, open circles, open orange upward triangles (some with a filled circle inside), open red downward triangles, and plus signs at the right margin; 6 markers ringed in orange, each with a rotated orange label; no legend
- Horizontal
- Days from start of therapy, −28 to 392, ticks every 28, labeled at −28, 0, 28, 56, 84, 112, 168, 224, 280, 336 and 392; a dotted gray vertical line at 0 and a dashed gray vertical line at 112; plus signs just beyond 392
- Vertical
- Participant ID (redacted), 33 rows, one per participant, labeled [participant IDs]; no axis line
- Visible pattern
- Filled circles sit near 0 in almost every row, a few up to about 30 days earlier. Orange upward triangles form a loose column between about 10 and 75 days. The red downward triangles step from about 300 days in the top row to a long column near 170 to 200 through the middle rows, then to about 75 to 115 in the bottom 6 rows. Open circles continue at roughly regular intervals to about 390 days, and plus signs end about 20 rows at the right margin. The 6 ringed markers lie between about 100 and 330 days, all but one to the right of the red triangle in their row; 5 labels read Relapse? and one reads Failure?.
Text in the picture
Participant ID (redacted)
Relapse?
Relapse?
Relapse?
Failure?
Relapse?
Relapse?
Days from start of therapy
Reves R, Heilig CM, Tapy JM, Bozeman L, Kyle RP, Hamilton CD, Bock N, Narita M, Wing D, Hershfield E, Goldberg SV, Tuberculosis Trials Consortium. Intermittent tuberculosis treatment for patients with isoniazid intolerance or drug resistance. International Journal of Tuberculosis and Lung Disease. 2014; 18(5): 571–580. DOI: 10.5588/ijtld.13.0304.
Abbreviations: DOI = digital object identifier; TB = tuberculosis.
- Panels
- 1
- Elements
- 27 rows, one per participant, each with up to 3 horizontal line segments in the legend's 3 styles (thin light gray, thick gray, dashed light gray), carrying 5 kinds of markers per the legend: circled plus, small filled circle, small open circle, asterisk and x; an 8-entry legend at upper right (3 line styles, 5 markers)
- Horizontal
- Days since start of tuberculosis therapy, −30 to 390, labeled every 30; data from about −45, with dashed follow-up lines running to the right edge, just past 390; no reference lines
- Vertical
- Participant index, 27 rows numbered 1 to 27 from the top, in 4 labeled sections of 8, 2, 15 and 2 rows
- Visible pattern
- Thin lines start at 0 in nearly every row, and thick lines take over between about 30 and 70 days and end between about 70 and 200. Dashed lines end between about 100 and 250 days in the top section and run to the right edge in most rows below. Filled circles cluster at and to the left of 0, and open circles fall along the lines at roughly regular intervals. Asterisks lie between about 70 and 175 days, mostly in the first and third sections; x marks appear in 3 rows between about 70 and 125; circled plus signs appear in 3 rows, near 120 and 325 days.
Text in the picture
Incomplete treatment, incomplete follow-up < 6 months
Incomplete treatment, incomplete follow-up ≥ 6 months
Incomplete treatment, complete follow-up
Complete treatment, late positive culture
Prestudy treatment
Study treatment
Follow-up
Treatment failure/relapse
Other positive culture
Negative culture
Hepatic adverse event
Nonhepatic adverse event
Participant index
Days since start of tuberculosis therapy
Abbreviations: TB = tuberculosis.
Text in the picture (summary)
A typeset table of clinical features, regimens and comments for each participant who discontinued study treatment because of adverse events, grouped by hepatic and non-hepatic events.
Abbreviations: TB = tuberculosis.

- Panels
- 1
- Elements
- Squares in a grid, 1 per cell, filled black or hollow, and x marks; many cells blank; no legend.
- Horizontal
- 54 columns, evenly spaced, with rotated coded labels in 9 groups of 6 by prefix, from left: gsasp, strng, inspt, npasp, stool, urine, blood, fnasp, cdrc. In the first 8 groups the labels run fm, xp, mg, each with the suffixes _1 and _2; the cdrc group has xp only, as cdrc1 to cdrc3, each with _1 and _2.
- Vertical
- 25 rows, one per child, each labeled at left with [participant IDs]; evenly spaced, no grouping.
- Visible pattern
- Hollow squares fill most of the first 6 groups of columns. A few rows are mostly filled squares across those groups, and filled squares are scattered through the other rows. Several rows hold marks only in every other column over part of their width, and 1 row near the bottom is blank except for 3 filled squares. The blood group holds marks in only 1 column, mostly hollow squares with a few x marks, down the lower two-thirds of the rows; the fnasp group holds marks in only 2 rows. The cdrc group holds marks in most rows from the 2nd to about the 21st, and none in the bottom 4. X marks are few and scattered.
Text in the picture (summary)
Rows labeled with numbers; 54 columns labeled with rotated coded variable names.
Study in progress, not yet published.
Abbreviations: TB = tuberculosis.
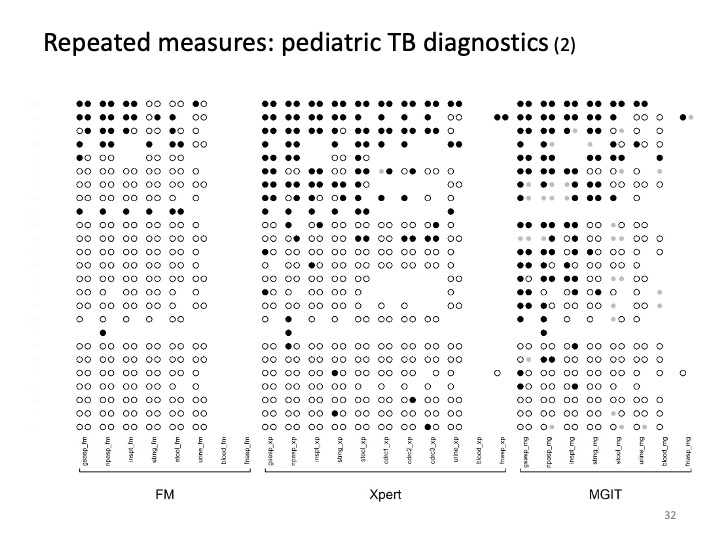
- Panels
- 1
- Elements
- Circles set side by side in pairs, up to 2 per column position, each filled black, hollow, or smaller and light gray; many positions blank or holding a single circle; no legend.
- Horizontal
- 27 column positions with rotated coded labels, in 3 blocks set apart by wider gaps and marked by brackets labeled FM (8 positions), Xpert (11) and MGIT (8). In each block the specimens run gsasp, npasp, inspt, strng, stool, urine, blood, fnasp; the Xpert block adds cdrc1, cdrc2 and cdrc3 between stool and urine.
- Vertical
- 25 rows, one per child, each labeled at left with [participant IDs]; evenly spaced, no grouping.
- Visible pattern
- Filled circles concentrate in the top rows of all 3 blocks and thin out downward; the lower rows are mostly hollow circles. In the FM block, filled circles appear only in the top 5 rows and 2 rows further down. The Xpert block is dense with filled circles through about the 9th row, with scattered filled circles below. In the MGIT block, filled circles reach further, through about the 18th row, and are scattered below; nearly all the gray circles are here. In FM the blood and fnasp positions are empty, and in Xpert the blood position is empty; the fnasp positions of Xpert and MGIT hold marks in only 2 rows, and the blood position of MGIT holds single circles in about half the rows. Several rows hold single circles rather than pairs, and 1 row is blank except for a single filled circle in each block.
Text in the picture (summary)
Column labels are coded variable names for specimen type and test; row labels are participant numbers.
Abbreviations: FM = fluorescence microscopy; MGIT = Mycobacteria Growth Indicator Tube (liquid culture system); TB = tuberculosis; Xpert = Xpert MTB/RIF (Cepheid GeneXpert cartridge nucleic acid amplification test for TB and rifampicin resistance).
Abbreviations
AIDS = acquired immunodeficiency syndrome; ART = antiretroviral therapy; CD4 = cluster of differentiation 4; CDC = Centers for Disease Control and Prevention; CI = confidence interval; CIN = cervical intraepithelial neoplasia; CNS = central nervous system; DOI = digital object identifier; FB = foreign-born; FM = fluorescence microscopy; FRN = Federal Register notice; HER/HERS = HIV Epidemiology Research (HER) Study; HHS = Department of Health and Human Services; HIV = human immunodeficiency virus; HIV+ = HIV-positive; ISBN = International Standard Book Number; JHU = Johns Hopkins University; MGIT = Mycobacteria Growth Indicator Tube (liquid culture system); MSM = men who have sex with men; NC = not countable; NHANES = National Health and Nutrition Examination Survey; NHL = non-Hodgkin lymphoma; OD = Office of the Director; OMB = Office of Management and Budget; PRA = Paperwork Reduction Act (as in the OMB information-collection clearance process); RBC = red blood cell; SIL+ = squamous intraepithelial lesion; STI = sexually transmitted infection; TB = tuberculosis; TBTC27 = Tuberculosis Trials Consortium Study 27; TBTC28 = Tuberculosis Trials Consortium Study 28; TIBC = total iron-binding capacity; TST = tuberculin skin test; UAI = unprotected anal intercourse; UK = United Kingdom; US = United States; USA = United States of America; Xpert = Xpert MTB/RIF (Cepheid GeneXpert cartridge nucleic acid amplification test for TB and rifampicin resistance).
References, compiled for this page
Full citations, with current links, for selected references and related works.
- Auld SC, Click ES, Heilig CM, Miramontes R, Cain KP, Bisson GP, Mac Kenzie WR. Association between tuberculin skin test result and clinical presentation of tuberculosis disease. BMC Infect Dis. 2013;13(1):460. DOI 10.1186/1471-2334-13-460.
- Dorman SE, Johnson JL, Goldberg S, Muzanye G, Padayatchi N, Bozeman L, Heilig CM, Bernardo J, Choudhri S, Grosset JH, et al. Substitution of moxifloxacin for isoniazid during intensive phase treatment of pulmonary tuberculosis. Am J Respir Crit Care Med. 2009;180(3):273–280. DOI 10.1164/rccm.200901-0078OC.
- Duerr A, Posner SF, Gilbert M. Evidence in support of foster care during acute refugee crises. Am J Public Health. 2003;93(11):1904–1909. DOI 10.2105/ajph.93.11.1904.
- Heilig CM, Lee LM. 2012. Speeding up public health science. (Unpublished data and graphic.)
- Millett GA, Peterson JL, Flores SA, Hart TA, Jeffries WL, Wilson PA, Rourke SB, Heilig CM, Elford J, Fenton KA, Remis RS. Comparisons of disparities and risks of HIV infection in black and other men who have sex with men in Canada, UK, and USA: a meta-analysis. Lancet. 2012;380(9839):341–348. DOI 10.1016/S0140-6736(12)60899-X.
- Paramsothy P, Duerr A, Heilig CM, Cu-Uvin S, Anderson JR, Schuman P, Klein RS. Abnormal vaginal cytology in HIV-infected and at-risk women after hysterectomy. JAIDS J Acquir Immune Defic Syndr. 2004;35(5):484–491. DOI 10.1097/00126334-200404150-00006.
- Phelps RM, Smith DK, Heilig CM, Gardner LI, Carpenter CCJ, Klein RS, Jamieson DJ, Vlahov D, Schuman P, Holmberg SD, HER Study Group. Cancer incidence in women with or at risk for HIV. Int J Cancer. 2001;94(5):753–757. DOI 10.1002/ijc.1528.
- Reves R, Heilig CM, Tapy JM, Bozeman L, Kyle RP, Hamilton CD, Bock N, Narita M, Wing D, Hershfield E, et al. Intermittent tuberculosis treatment for patients with isoniazid intolerance or drug resistance. Int J Tuberc Lung Dis. 2014;18(5):571–580. DOI 10.5588/ijtld.13.0304.
- Song R, Click ES, McCarthy KD, Heilig CM, Mchembere W, Smith JP, Fajans M, Musau SK, Okeyo E, Okumu A, et al. Sensitive and feasible specimen collection and testing strategies for diagnosing tuberculosis in young children. JAMA Pediatr. 2021;175(5):e206069. DOI 10.1001/jamapediatrics.2020.6069.
- Tohill BC, Heilig CM, Klein RS, Rompalo A, Cu-Uvin S, Piwoz EG, Jamieson DJ, Duerr A. Nutritional biomarkers associated with gynecological conditions among US women with or at risk of HIV infection. Am J Clin Nutr. 2007;85(5):1327–1334. DOI 10.1093/ajcn/85.5.1327.