Composing data graphics as a literary act
This rendering was constructed from an original PowerPoint presentation. Corrections of original text are indicated as “[corrected: X]”, redactions as “[redacted: X]”, and names withheld as “[generalized: X]”. Handouts and other auxiliary sources mentioned in the presentations are not available. The content of each presentation was believed to be correct and valid at the time of the presentation. This content, including references and links within the slides, has not been checked or updated when preparing this site. This rendering was facilitated by Anthropic Claude agentic tools for automated text extraction through computer vision and for assistance with compiling the completed sets.
Setting: Composing data graphics as a literary act, 2022-04-19. Agency for Toxic Substances and Disease Registry seminar.
“Composing data graphics as a literary act”, 2022. This presentation told a story about telling stories from real data. I sought to make essential narratives available to the reader by first being my own reader and critic.
There is a difference between a book of 200 pages from the very beginning, and a book of 200 which is the result of an original 800. The 600 are there. Only you don’t see them. (Wiesel)
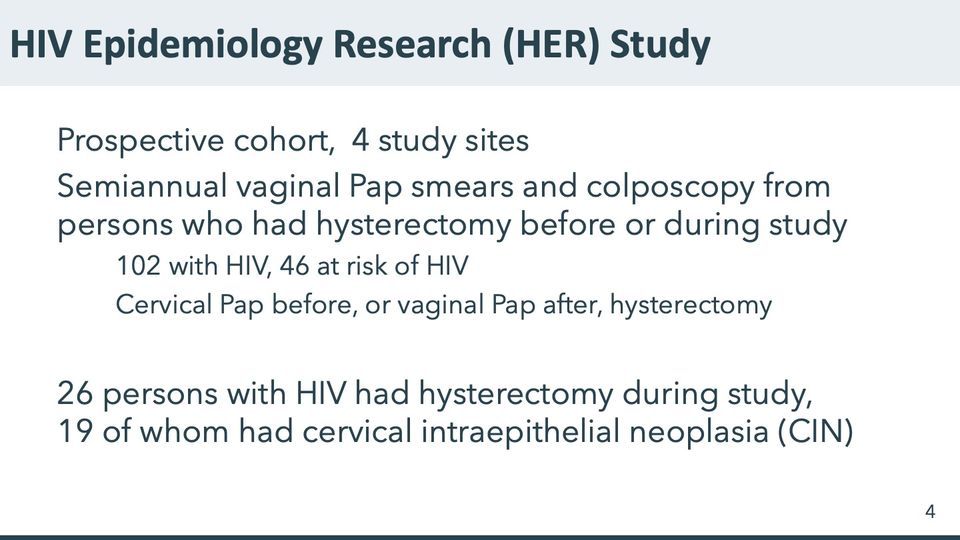
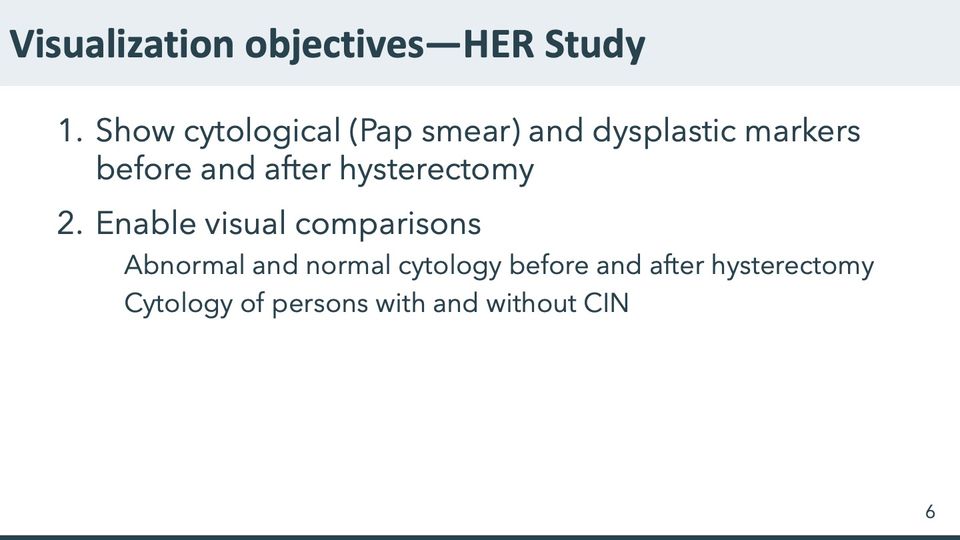
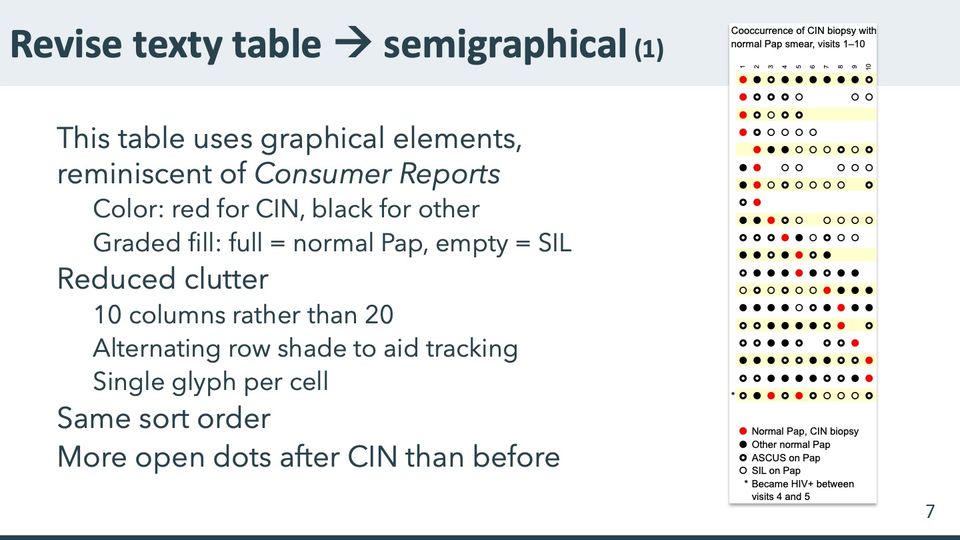
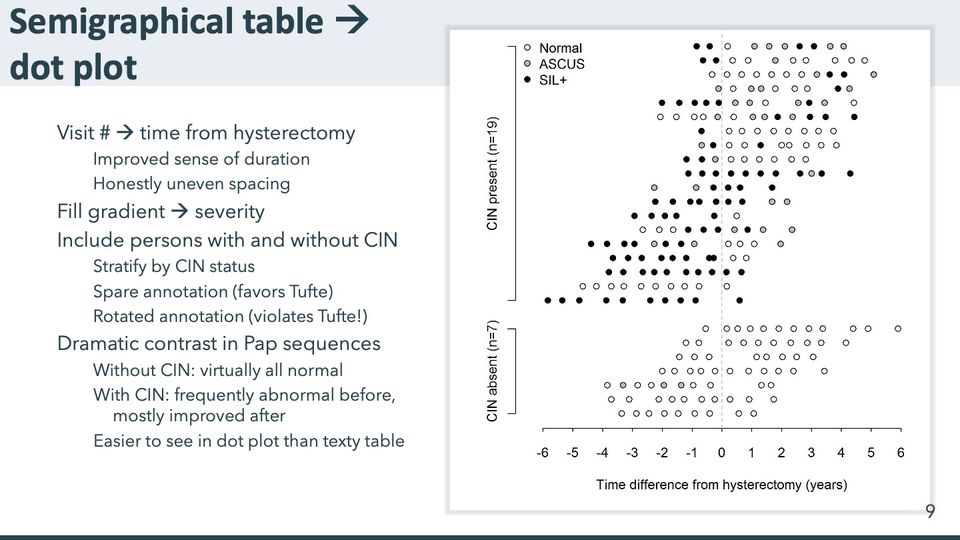
The HIV Epidemiology Research Study enrolled 871 women with or at risk for HIV. A dot chart of 26 women who had a hysterectomy during the study shows 119 Pap smear results before hysterectomy and 138 after. Women with abnormal biopsies had persistently unfavorable cytology before hysterectomy, improving somewhat afterward. Not shown: 845 other participants, 122 of whom had a hysterectomy before the study.
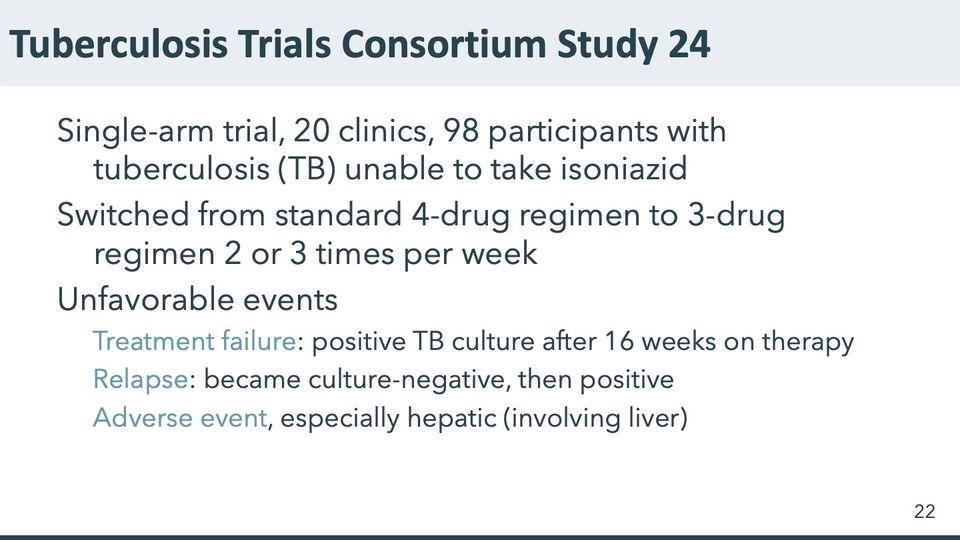
The Tuberculosis Trials Consortium Study 24 enrolled 98 persons with TB who were unable to take isoniazid, 27 of whom had unfavorable experiences. A dot plot of their histories depicts 78 time segments, 202 culture results (19 positive as of enrollment, 26 positive after), and 15 adverse events (12 hepatic). Not shown: 71 participants within norms.
A study of 300 children in Western Kenya with signs of TB assayed multiple diagnostics and up to 8 specimen types. We found 32 children with evidence of TB. A dot chart with up to 53 results for each child shows the variation in yield by specimen and diagnostic type: 1295 results, 440 positive, 823 negative, 32 indeterminate. Not shown: 268 children with no positive result.
Did we achieve literary excellence?
- Complex [graphics] precisely reflect complex ideas (Williams)
- Meet readers’ expectations, and at the same time surprise them (Williams)
- Trust the reader’s intelligence (Strunk and White)
- Take the position of the reader; apply a reader’s pressure (Lanham)
Did we achieve graphical excellence?
- Communicate complex ideas with clarity, precision, and efficiency (Tufte)
- Give access to the subtle and the difficult and reveal the complex (Tufte)
- Give the greatest number of ideas in the shortest time with the least ink in the smallest space (Tufte)
- Induce the viewer to think about substance rather than about methodology, design, or technology of production (Tufte)
The patron superhero of the dot plot is Dot Warner, sister to the Warner brothers Yakko and Wakko. Slide 56

Text in the picture
CDC
Abbreviations: ATSDR = Agency for Toxic Substances and Disease Registry; CDC = Centers for Disease Control and Prevention.

Abbreviations: HIV = human immunodeficiency virus.

Abbreviations: HIV = human immunodeficiency virus.
Abbreviations: CIN = cervical intraepithelial neoplasia; HER/HERS = HIV Epidemiology Research (HER) Study; HIV = human immunodeficiency virus.
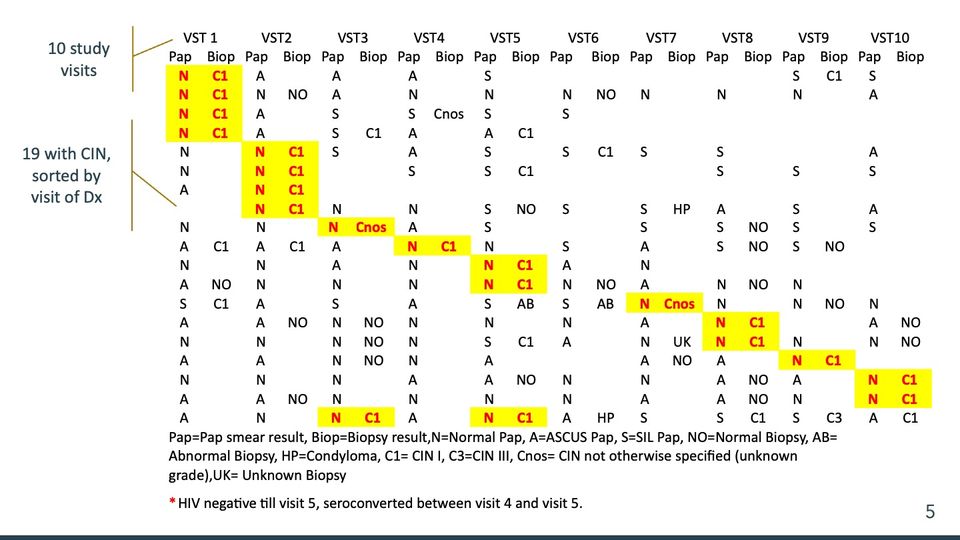
The table has 10 visit column groups, each split into Pap and Biop subcolumns, and 19 rows. In each row one pair of cells (2 in the last row) is shaded yellow with red bold text; these highlighted pairs step from the first visit at the top left down to the tenth visit near the bottom right, so they form a staircase across the table. Many cells are empty, especially in the Biop subcolumns and toward the right of the upper rows. At the left, 2 brackets with labels point to the header row and to the rows. A legend of abbreviations and a footnote with a red asterisk sit below the table. In the transcription below, cells are separated by vertical bars and empty cells are left empty.
Text in the picture
VST 1 | VST2 | VST3 | VST4 | VST5 | VST6 | VST7 | VST8 | VST9 | VST10
Pap | Biop | Pap | Biop | Pap | Biop | Pap | Biop | Pap | Biop | Pap | Biop | Pap | Biop | Pap | Biop | Pap | Biop | Pap | Biop
N | C1 | A | | A | | A | | S | | | | | | | | S | C1 | S |
N | C1 | N | NO | A | | N | | N | | N | NO | N | | N | | N | | A |
N | C1 | A | | S | | S | Cnos | S | | S | | | | | | | | |
N | C1 | A | | S | C1 | A | | A | C1 | | | | | | | | | |
N | | N | C1 | S | | A | | S | | S | C1 | S | | S | | | | A |
N | | N | C1 | | | S | | S | C1 | | | | | S | | S | | S |
A | | N | C1 | | | | | | | | | | | | | | | |
| | N | C1 | N | | N | | S | NO | S | | S | HP | A | | S | | A |
N | | N | | N | Cnos | A | | S | | | | S | | S | NO | S | | S |
A | C1 | A | C1 | A | | N | C1 | N | | S | | A | | S | NO | S | NO | |
N | | N | | A | | N | | N | C1 | A | | N | | | | | | |
A | NO | N | | N | | N | | N | C1 | N | NO | A | | N | NO | N | | |
S | C1 | A | | S | | A | | S | AB | S | AB | N | Cnos | N | | N | NO | N |
A | | A | NO | N | NO | N | | N | | N | | A | | N | C1 | | | A | NO
N | | N | | N | NO | N | | S | C1 | A | | N | UK | N | C1 | N | | N | NO
A | | A | | N | NO | N | | A | | | | A | NO | A | | N | C1 | |
N | | N | | N | | A | | A | NO | N | | N | | A | NO | A | | N | C1
A | | A | NO | N | | N | | N | | N | | A | | A | NO | N | | N | C1
A | | N | | N | C1 | A | | N | C1 | A | HP | S | | S | C1 | S | C3 | A | C1
Pap=Pap smear result, Biop=Biopsy result,N=Normal Pap, A=ASCUS Pap, S=SIL Pap, NO=Normal Biopsy, AB=
Abnormal Biopsy, HP=Condyloma, C1= CIN I, C3=CIN III, Cnos= CIN not otherwise specified (unknown
grade),UK= Unknown Biopsy
* HIV negative till visit 5, seroconverted between visit 4 and visit 5.
Abbreviations: AB = abnormal biopsy; C1 = cervical intraepithelial neoplasia grade 1; C3 = cervical intraepithelial neoplasia grade 3; CIN = cervical intraepithelial neoplasia; Cnos = cervical intraepithelial neoplasia, not otherwise specified; Dx = diagnosis; HIV = human immunodeficiency virus; HP = condyloma; NO = normal biopsy; SIL = squamous intraepithelial lesion; UK = unknown biopsy; VST = visit.
Abbreviations: CIN = cervical intraepithelial neoplasia; HER/HERS = HIV Epidemiology Research (HER) Study.
- Panels
- 1
- Elements
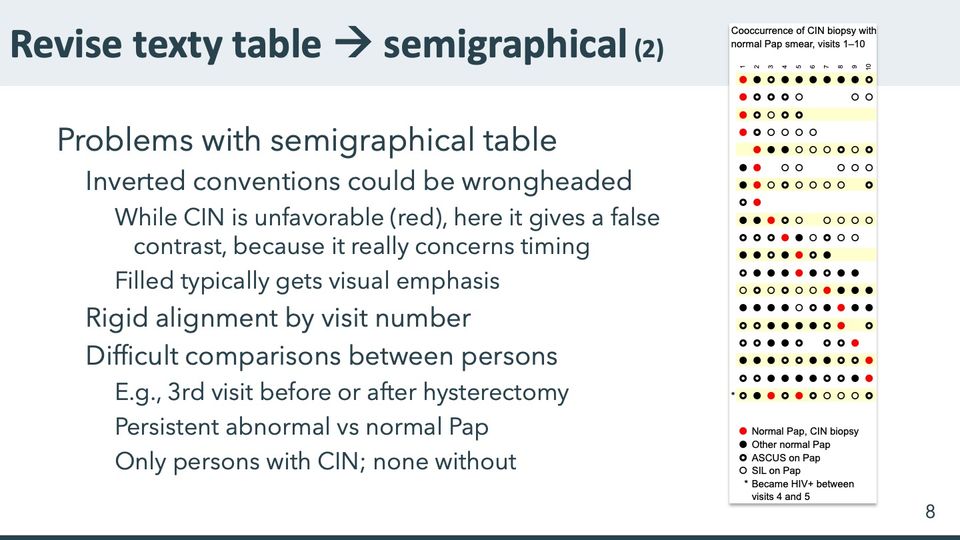
- 19 rows of single glyphs in up to 10 columns, 4 glyph types (red filled dot, black filled dot, thick black ring, thin open circle) depict results per visit as given in the legend; alternate rows shaded pale yellow; the last row marked with an asterisk at its left
- Horizontal
- 10 columns, visits 1 to 10, labels rotated
- Vertical
- 19 unlabeled rows; legend below the grid
- Visible pattern
- The red dots step down from the first column at the top to the tenth column near the bottom, a staircase from upper left to lower right; the last row has 2 red dots, toward the left. Several upper rows are short or have gaps, ending by about visit 5 or skipping visits, while most rows in the lower half span nearly all 10 columns. Black filled dots and thick rings are mixed throughout, and thin open circles appear more often to the right of the red dots than to the left.
Text in the picture
Cooccurrence of CIN biopsy with
normal Pap smear, visits 1–10
1 2 3 4 5 6 7 8 9 10
*
Normal Pap, CIN biopsy
Other normal Pap
ASCUS on Pap
SIL on Pap
* Became HIV+ between
visits 4 and 5
Abbreviations: CIN = cervical intraepithelial neoplasia; HIV+ = HIV-positive; SIL = squamous intraepithelial lesion.
- Panels
- 1
- Elements
- 19 rows of single glyphs in up to 10 columns, 4 glyph types (red filled dot, black filled dot, thick black ring, thin open circle) depict results per visit as given in the legend; alternate rows shaded pale yellow; the last row marked with an asterisk at its left
- Horizontal
- 10 columns, visits 1 to 10, labels rotated
- Vertical
- 19 unlabeled rows; legend below the grid
- Visible pattern
- The red dots step down from the first column at the top to the tenth column near the bottom, a staircase from upper left to lower right; the last row has 2 red dots, toward the left. Several upper rows are short or have gaps, ending by about visit 5 or skipping visits, while most rows in the lower half span nearly all 10 columns. Black filled dots and thick rings are mixed throughout, and thin open circles appear more often to the right of the red dots than to the left.
Text in the picture
Cooccurrence of CIN biopsy with
normal Pap smear, visits 1–10
1 2 3 4 5 6 7 8 9 10
*
Normal Pap, CIN biopsy
Other normal Pap
ASCUS on Pap
SIL on Pap
* Became HIV+ between
visits 4 and 5
Paramsothy P, Duerr A, Heilig CM, Cu-Uvin S, Anderson JR, Schuman P, Klein RS. Abnormal vaginal cytology in HIV-infected and at-risk women after hysterectomy. J Acquir Immune Defic Syndr 2004; 35: 484–491. DOI: 10.1097/00126334-200404150-00006.
Abbreviations: CIN = cervical intraepithelial neoplasia; DOI = digital object identifier; HIV = human immunodeficiency virus; HIV+ = HIV-positive; SIL = squamous intraepithelial lesion.
- Panels
- 1
- Elements
- 26 rows of dots, one row per person, in 3 fills (white, gray, black) depicting Pap results as given in the legend; dots within a row unevenly spaced
- Horizontal
- Time difference from hysterectomy (years), -6 to 6, ticks every year; data from about -5.8 to 5.9; dashed vertical guide at 0
- Vertical
- 26 unlabeled rows in 2 bracketed groups, 19 above and 7 below, group labels rotated; legend inside the upper left
- Visible pattern
- In the upper group (CIN present), the rows shift leftward going down: the top rows run from about -1 to 5 years and the bottom rows from about -6 to about 0.5. In that group black and gray dots are dense to the left of zero, though some upper rows have black and gray dots out to about 4 years. In the lower group the rows together span about -4 to 6 years and nearly every dot is white, with a few gray dots in one row between about -3.5 and -1.5.
Text in the picture
Normal
ASCUS
SIL+
CIN present (n=19)
CIN absent (n=7)
-6 -5 -4 -3 -2 -1 0 1 2 3 4 5 6
Time difference from hysterectomy (years)
Abbreviations: CIN = cervical intraepithelial neoplasia; SIL+ = squamous intraepithelial lesion.
- Panels
- 1
- Elements
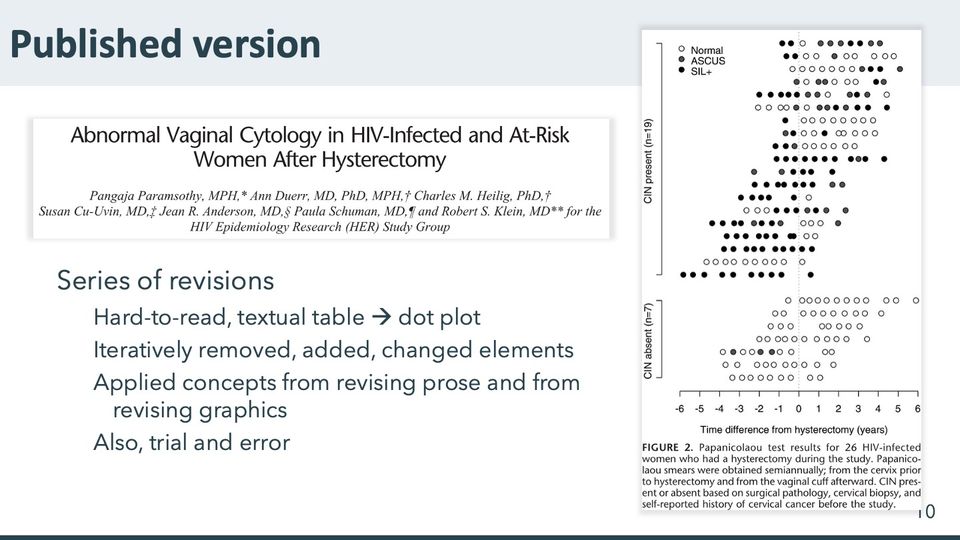
- 26 rows of dots, one row per person, in 3 fills (white, dark gray, black) depicting Pap results as given in the legend; dots within a row unevenly spaced, some touching
- Horizontal
- Time difference from hysterectomy (years), -6 to 6, ticks every year; data from about -5.8 to 5.9; dotted vertical guide at 0
- Vertical
- 26 unlabeled rows in 2 bracketed groups, 19 above and 7 below, group labels rotated; legend inside the upper left
- Visible pattern
- In the upper group (CIN present), the rows shift leftward going down: the top rows run from about -1 to 5 years and the bottom rows from about -6 to about 0.5. In that group black and gray dots are dense to the left of zero, though some upper rows have black and gray dots out to about 4 years. In the lower group the rows together span about -4 to 6 years and nearly every dot is white, with a few gray dots in one row between about -3.5 and -1.5.
Text in the picture
Abnormal Vaginal Cytology in HIV-Infected and At-Risk
Women After Hysterectomy
Pangaja Paramsothy, MPH,* Ann Duerr, MD, PhD, MPH,† Charles M. Heilig, PhD,†
Susan Cu-Uvin, MD,‡ Jean R. Anderson, MD,§ Paula Schuman, MD,¶ and Robert S. Klein, MD** for the
HIV Epidemiology Research (HER) Study Group
Normal
ASCUS
SIL+
CIN present (n=19)
CIN absent (n=7)
-6 -5 -4 -3 -2 -1 0 1 2 3 4 5 6
Time difference from hysterectomy (years)
FIGURE 2. Papanicolaou test results for 26 HIV-infected
women who had a hysterectomy during the study. Papanico-
laou smears were obtained semiannually; from the cervix prior
to hysterectomy and from the vaginal cuff afterward. CIN pres-
ent or absent based on surgical pathology, cervical biopsy, and
self-reported history of cervical cancer before the study.
Paramsothy P, Duerr A, Heilig CM, Cu-Uvin S, Anderson JR, Schuman P, Klein RS. Abnormal vaginal cytology in HIV-infected and at-risk women after hysterectomy. J Acquir Immune Defic Syndr 2004; 35: 484–491. DOI: 10.1097/00126334-200404150-00006.
Abbreviations: CIN = cervical intraepithelial neoplasia; DOI = digital object identifier; HER/HERS = HIV Epidemiology Research (HER) Study; HIV = human immunodeficiency virus; SIL+ = squamous intraepithelial lesion.


https://www.writerswrite.co.za/what-20-famous-authors-had-to-say-about-rewriting/
Put down everything that comes into your head and then you’re a writer. But an author is one who can judge his own stuff’s worth, without pity, and destroy most of it. ~Colette
There is a difference between a book of two hundred pages from the very beginning, and a book of two hundred pages which is the result of an original eight hundred pages. The six hundred are there. Only you don’t see them. ~Elie Wiesel

Strunk W, White EB. The elements of style. 4th ed. Allyn and Bacon, 1999. ISBN-10: 020530902X.
Abbreviations: ISBN = International Standard Book Number.

Strunk W, White EB. The elements of style. 4th ed. Allyn and Bacon, 1999. ISBN-10: 020530902X.
Abbreviations: ISBN = International Standard Book Number.

Lanham RA. Revising prose. 2nd ed. Macmillan, 1987. ISBN-10: 0023674407.
Abbreviations: ISBN = International Standard Book Number.

Williams JM. Style: toward clarity and grace. University of Chicago Press, 1990. ISBN-10: 0226899144.
Abbreviations: ISBN = International Standard Book Number.

Tufte ER. The visual display of quantitative information. Graphics Press, 1983. ISBN-10: 096139210X.
Graphical excellence
is the well-designed presentation of interesting data — a matter of substance, of statistics, and of design.
consists of complex ideas communicated with clarity, precision, and efficiency.
Abbreviations: ISBN = International Standard Book Number.

Tufte ER. The visual display of quantitative information. Graphics Press, 1983. ISBN-10: 096139210X.
Abbreviations: ISBN = International Standard Book Number.

Tufte ER. The visual display of quantitative information. Graphics Press, 1983. ISBN-10: 096139210X.
"An occasional data graphic displays such care in design that it is particularly accessible and open to the eye, as if the designer had the viewer in mind at every turn while constructing the graphic. This is the friendly data graphic.”
Abbreviations: ISBN = International Standard Book Number.

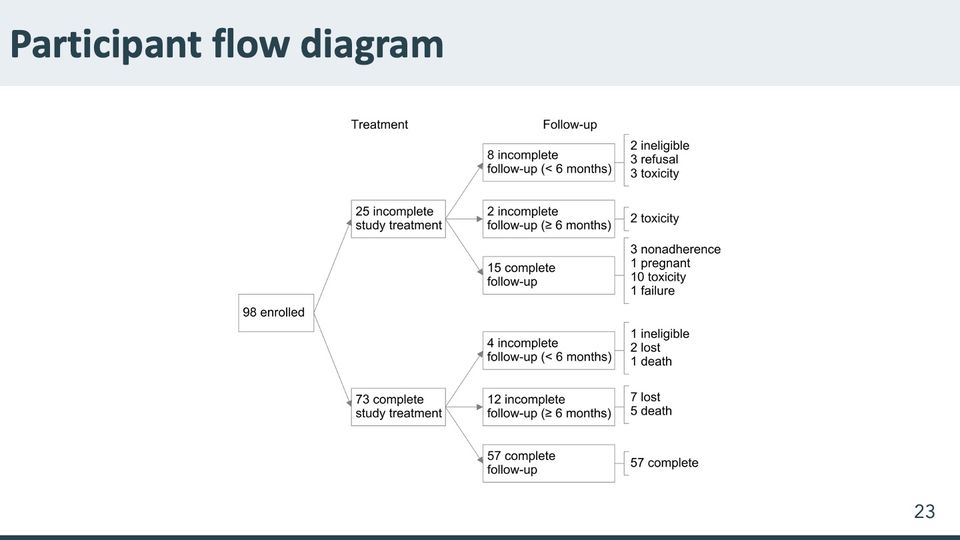
Reves R, Heilig CM, Tapy JM, Bozeman L, Kyle RP, Hamilton CD, Bock N, Narita M, Wing D, Hershfield E, Goldberg SV, Tuberculosis Trials Consortium. Intermittent tuberculosis treatment for patients with isoniazid intolerance or drug resistance. International Journal of Tuberculosis and Lung Disease. 2014; 18(5): 571–580. DOI: 10.5588/ijtld.13.0304.
Abbreviations: DOI = digital object identifier; TB = tuberculosis.
- Panels
- 1
- Elements
- 9 boxes joined by 8 arrows in a tree that branches one to 2 to 6; beside each of the 6 boxes at the right, a bracket enclosing a list of one to 4 reasons with counts
- Horizontal
- 4 columns from left to right: the enrollment box, the boxes under the heading Treatment, the boxes under the heading Follow-up, and the bracketed reasons
- Vertical
- 2 branches, upper and lower, each splitting into 3 boxes stacked top to bottom
- Visible pattern
- The single box at the left splits into an upper and a lower box under Treatment, and each of those splits into 3 boxes under Follow-up, giving a column of 6 boxes. Each of the 6 has a bracket at its right listing one to 4 reasons with counts; the bracket beside the lowest box repeats that box's count.
Text in the picture
98 enrolled
25 incomplete study treatment
8 incomplete follow-up (< 6 months)
2 ineligible
3 refusal
3 toxicity
2 incomplete follow-up (≥ 6 months)
2 toxicity
15 complete follow-up
3 nonadherence
1 pregnant
10 toxicity
1 failure
73 complete study treatment
4 incomplete follow-up (< 6 months)
1 ineligible
2 lost
1 death
12 incomplete follow-up (≥ 6 months)
7 lost
5 death
57 complete follow-up
57 complete
Reves R, Heilig CM, Tapy JM, Bozeman L, Kyle RP, Hamilton CD, Bock N, Narita M, Wing D, Hershfield E, Goldberg SV, Tuberculosis Trials Consortium. Intermittent tuberculosis treatment for patients with isoniazid intolerance or drug resistance. International Journal of Tuberculosis and Lung Disease. 2014; 18(5): 571–580. DOI: 10.5588/ijtld.13.0304.
Abbreviations: DOI = digital object identifier.
Text in the picture (summary)
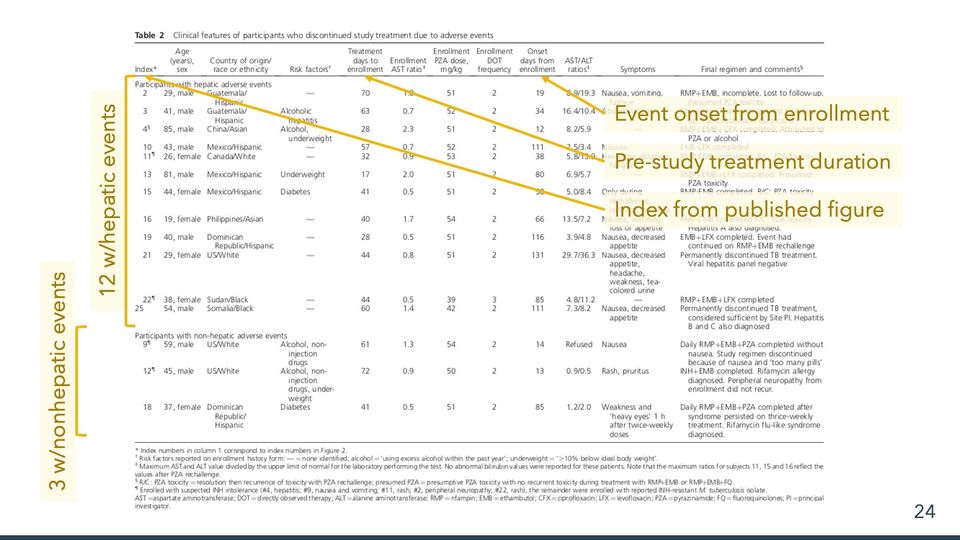
A published table of clinical features of participants who stopped study treatment because of adverse events, with footnotes.
Reves R, Heilig CM, Tapy JM, Bozeman L, Kyle RP, Hamilton CD, Bock N, Narita M, Wing D, Hershfield E, Goldberg SV, Tuberculosis Trials Consortium. Intermittent tuberculosis treatment for patients with isoniazid intolerance or drug resistance. International Journal of Tuberculosis and Lung Disease. 2014; 18(5): 571–580. DOI: 10.5588/ijtld.13.0304.
Abbreviations: DOI = digital object identifier.
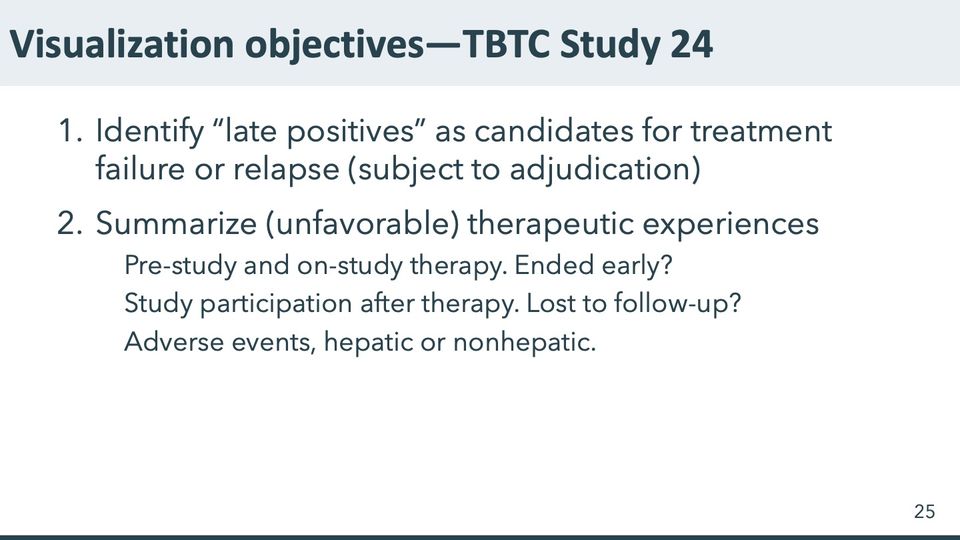
Abbreviations: TBTC = Tuberculosis Trials Consortium (CDC-sponsored).
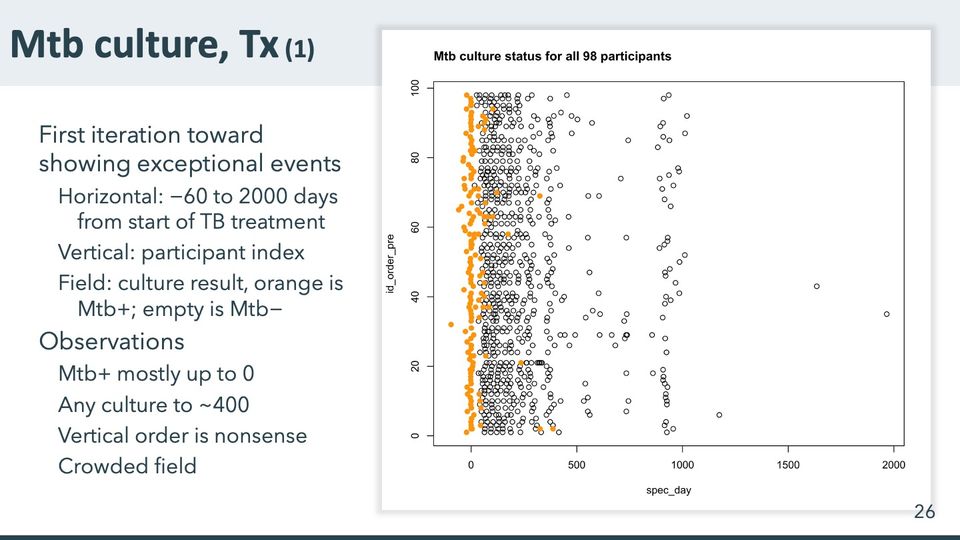
- Panels
- 1
- Elements
- Several hundred circles in rows, one row per participant: orange filled circles and open black circles; a box frame around the plot; no legend
- Horizontal
- spec_day, labeled 0 to 2000 every 500; data from about −90 to about 1950, with a little excess space at both ends inside the box frame
- Vertical
- id_order_pre, 0 to 100, labeled every 20; rows evenly spaced at about 1 to 98
- Visible pattern
- Orange filled circles form a narrow column close to 0 that runs through nearly every row, with a few strays to the left, to about −90, and to the right, to about 350. Open circles are dense from about 0 to 400 days, thin out between about 500 and 800, and gather again in a loose column near 900 to 1000 that spans most rows. Three open circles lie far to the right, between about 1200 and 2000.
Text in the picture
Mtb culture status for all 98 participants
Abbreviations: Mtb = Mycobacterium tuberculosis (the bacterium that causes TB); TB = tuberculosis; Tx = treatment.
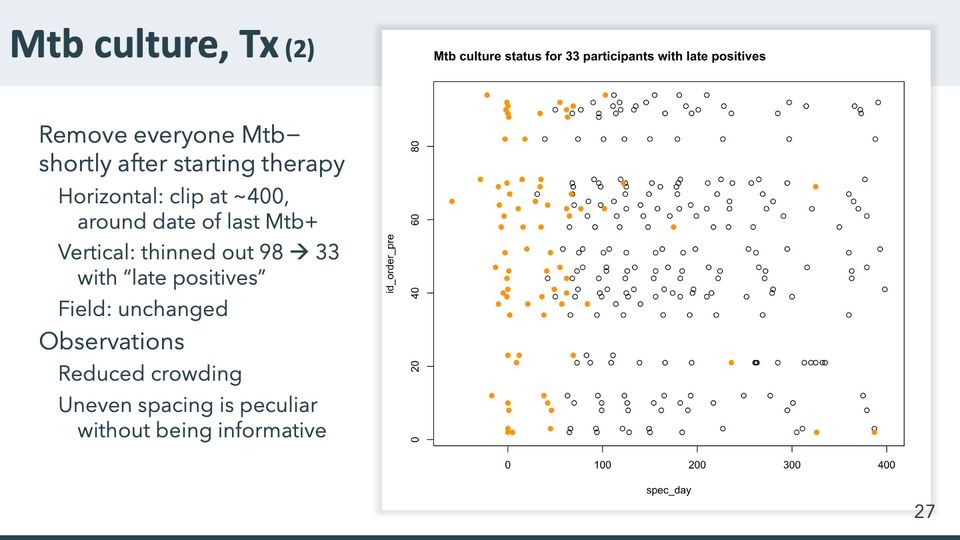
- Panels
- 1
- Elements
- Circles in 33 rows, one row per participant: orange filled circles and open black circles; a box frame around the plot; no legend
- Horizontal
- spec_day, labeled 0 to 400 every 100; data from about −60 to about 400
- Vertical
- id_order_pre, labeled 0 to 80 every 20; 33 rows at uneven intervals
- Visible pattern
- Compared with the previous slide, the field is clipped at about 400 days and holds only 33 rows, which fall in clusters separated by wide empty gaps: a few rows near the bottom, a pair low in the field, a thick band through the middle and a group near the top. Orange circles gather at the left, in a column near 0 and a looser spread between about 0 and 100 days, with a handful farther right, to about 390. Open circles spread fairly evenly from about 40 to 400 days.
Text in the picture
Mtb culture status for 33 participants with late positives
Abbreviations: Mtb = Mycobacterium tuberculosis (the bacterium that causes TB); Tx = treatment.
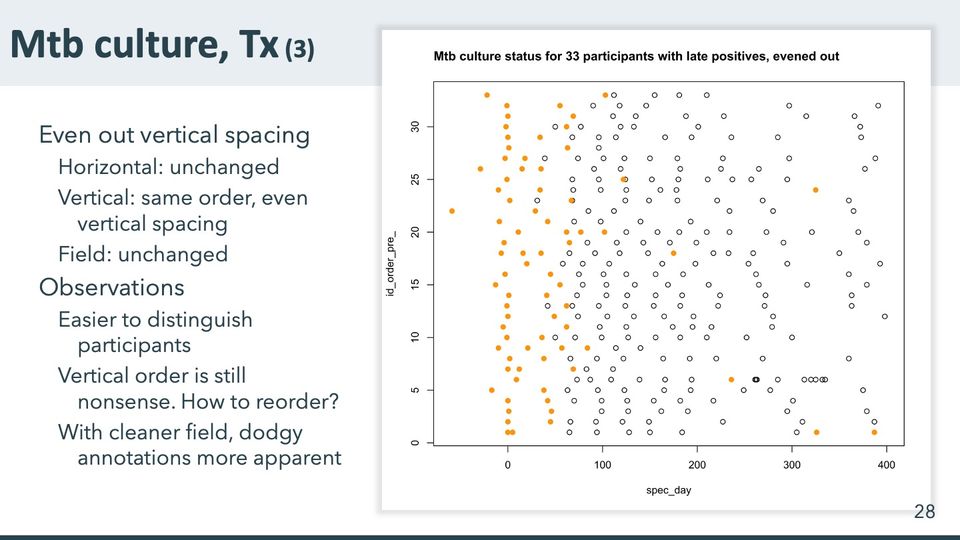
- Panels
- 1
- Elements
- Circles in 33 evenly spaced rows, one row per participant: orange filled circles and open black circles; a box frame around the plot; no legend
- Horizontal
- spec_day, labeled 0 to 400 every 100; data from about −60 to about 400
- Vertical
- id_order_pre_, labeled 0 to 30 every 5; 33 evenly spaced rows at 1 to 33
- Visible pattern
- Compared with the previous slide, the same points sit in 33 evenly spaced rows that fill the frame. Orange circles form a column at 0 in almost every row and a second, looser band between about 30 and 70 days, with a few scattered farther right, to about 390. Open circles begin around 40 to 70 days, giving the open field a ragged left edge, and continue to about 400.
Text in the picture
Mtb culture status for 33 participants with late positives, evened out
Abbreviations: Mtb = Mycobacterium tuberculosis (the bacterium that causes TB); Tx = treatment.
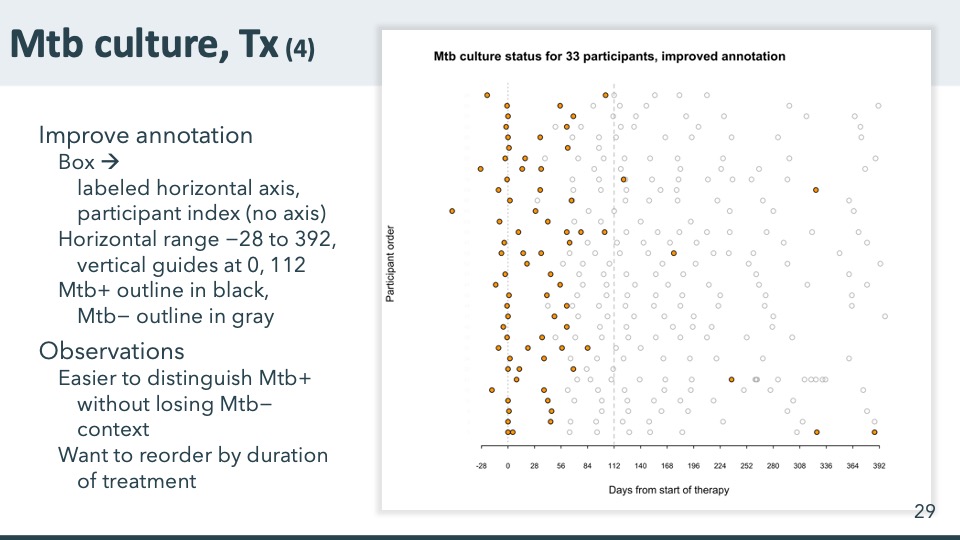
- Panels
- 1
- Elements
- Circles in 33 rows, one row per participant: orange filled circles with black outlines and open circles with gray outlines; a dotted vertical guide at 0 and a dashed one at 112 days; no frame; no legend
- Horizontal
- Days from start of therapy, −28 to 392, labeled every 28; data from about −60 to the right end of the axis
- Vertical
- Participant order, 33 rows labeled with index numbers redacted; no axis line
- Visible pattern
- Compared with the previous slide, the same points keep their rows and order, the frame gives way to a labeled horizontal axis and 2 guides, and open circles are drawn in light gray. Orange circles sit mostly to the left of the guide at 112: a column at 0 in nearly every row and a looser band between about 28 and 84 days. Only a handful lie beyond it, scattered between about 120 and 390. Gray circles fill the rows from about 28 to 392, often at roughly regular intervals.
Text in the picture
Mtb culture status for 33 participants, improved annotation
Note extremes: earliest positive for participant [redacted: index number], latest positive for participant [redacted: index number]
Abbreviations: Mtb = Mycobacterium tuberculosis (the bacterium that causes TB); Tx = treatment.
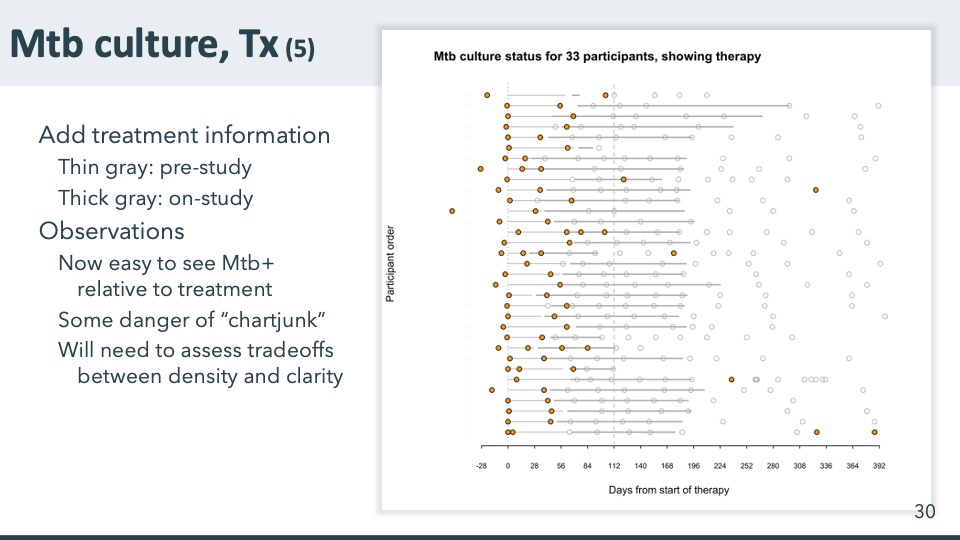
- Panels
- 1
- Elements
- Circles in 33 rows, orange filled or gray open; in each row a thin gray line starting at 0 followed by a thick gray line; a dotted vertical guide at 0 and a dashed one at 112 days
- Horizontal
- Days from start of therapy, −28 to 392, labeled every 28
- Vertical
- Participant order, 33 rows labeled with index numbers redacted; no axis line
- Visible pattern
- In each row a thin line runs from 0 into a thick line. Most thick lines end between about 170 and 200 days; a few in the top rows run longer, to about 240 to 300, and a few rows near the top and bottom end short, before about 112. Orange circles stay mostly at 0 and between about 28 and 84, on or near the lines, while the gray circles beyond the line ends continue to about 392.
Text in the picture
Mtb culture status for 33 participants, showing therapy
Abbreviations: Mtb = Mycobacterium tuberculosis (the bacterium that causes TB); Tx = treatment.
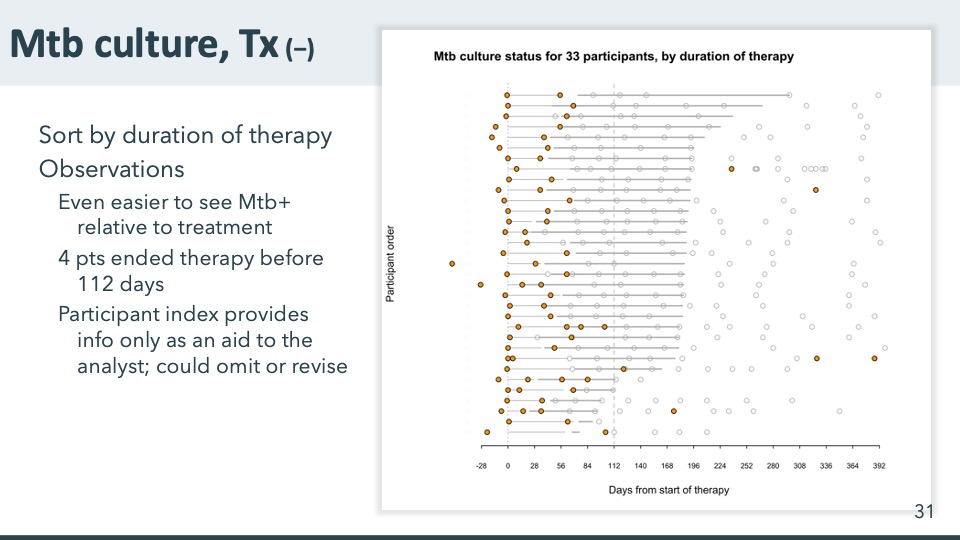
- Panels
- 1
- Elements
- Circles in 33 rows, orange filled or gray open; in each row a thin gray line starting at 0 followed by a thick gray line; a dotted vertical guide at 0 and a dashed one at 112 days
- Horizontal
- Days from start of therapy, −28 to 392, labeled every 28
- Vertical
- Participant order, 33 rows labeled with index numbers, now in a new order (redacted); no axis line
- Visible pattern
- The right ends of the thick lines now step down from upper right to lower left, from about 300 days in the top row to about 80 in the bottom row, a staircase whose long middle stretch ends between about 170 and 200. The bottom few rows end before the second guide. Orange circles stay in a column at 0 and a looser band between about 28 and 84, with a few farther right; gray circles continue past the line ends to about 392.
Text in the picture
Mtb culture status for 33 participants, by duration of therapy
Abbreviations: Mtb = Mycobacterium tuberculosis (the bacterium that causes TB); Tx = treatment.
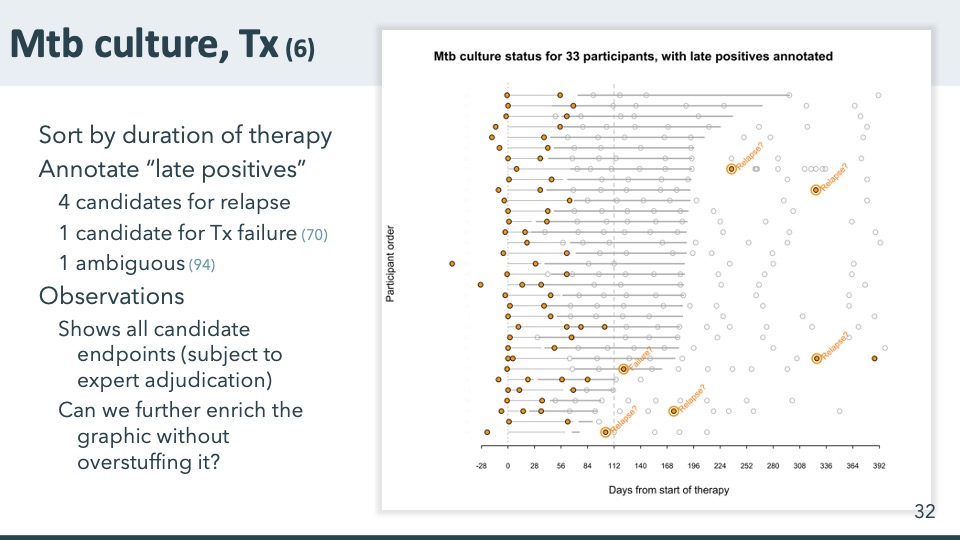
- Panels
- 1
- Elements
- Circles in 33 rows, orange filled or gray open; thin and thick gray lines per row; a dotted vertical guide at 0 and a dashed one at 112 days; 6 orange circles ringed in orange, each with a rotated orange label
- Horizontal
- Days from start of therapy, −28 to 392, labeled every 28
- Vertical
- Participant order, 33 rows labeled with index numbers (redacted); no axis line
- Visible pattern
- The chart is the sorted version, with its staircase of thick lines stepping down from upper right to lower left. Six orange circles are ringed and labeled; they lie between about 100 and 330 days, all but one at or beyond the right end of the thick line in their row. Five labels read Relapse? and one reads Failure?, spread from the upper rows to the bottom row.
Text in the picture
Mtb culture status for 33 participants, with late positives annotated
Relapse?
Relapse?
Relapse?
Failure?
Relapse?
Relapse?
Abbreviations: Mtb = Mycobacterium tuberculosis (the bacterium that causes TB); Tx = treatment.
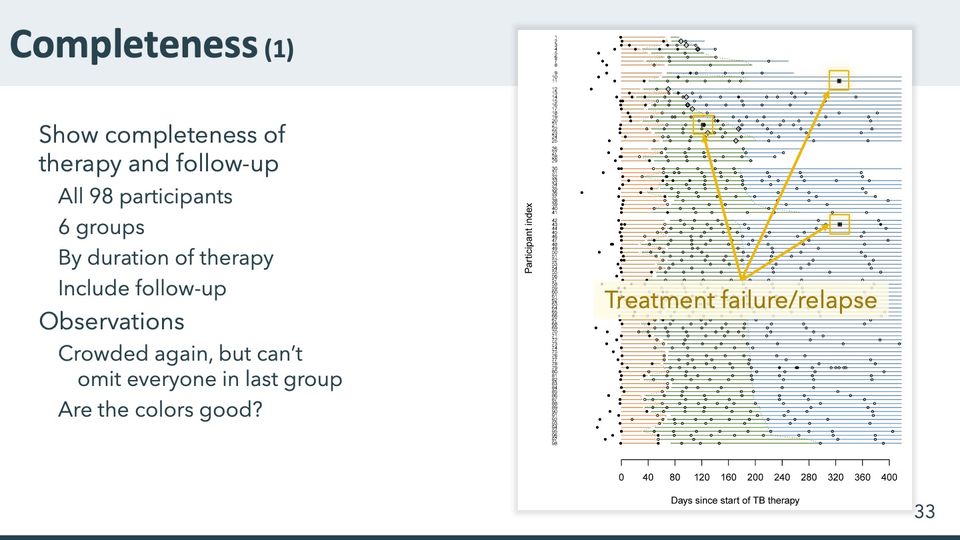
- Panels
- 1
- Elements
- 98 rows, one per participant, each a horizontal line in up to 3 colored segments (orange, then green, then blue); dotted lines join the segment ends across neighboring rows; markers: filled black circles, open circles, filled and open diamonds, and filled squares; no legend. Overlaid: 3 yellow squares around markers, with yellow arrows to a callout on a pale translucent box that fades the rows behind it
- Horizontal
- Days since start of TB therapy, 0 to 400, labeled every 40; data from about −55, with lines running a little past 400
- Vertical
- Participant index, 98 rows numbered from top to bottom in very small type, in 6 groups separated by small gaps; no group labels
- Visible pattern
- Orange segments start near 0 and end around 50 to 70 days in most rows; green segments follow to between about 110 and 200 in most rows, and the dotted lines trace those uneven ends down the chart, jogging right to about 300 in the bottom rows. Blue segments run on to the right edge in most rows, while lines in the top group are the shortest. Filled black circles cluster at and to the left of 0, open circles fall at roughly regular intervals along the lines, and diamonds lie mainly in the upper groups between about 70 and 175 days. The 3 boxed markers are filled squares near 120 and 320 to 330 days, in the upper and middle parts of the chart.
Abbreviations: TB = tuberculosis.
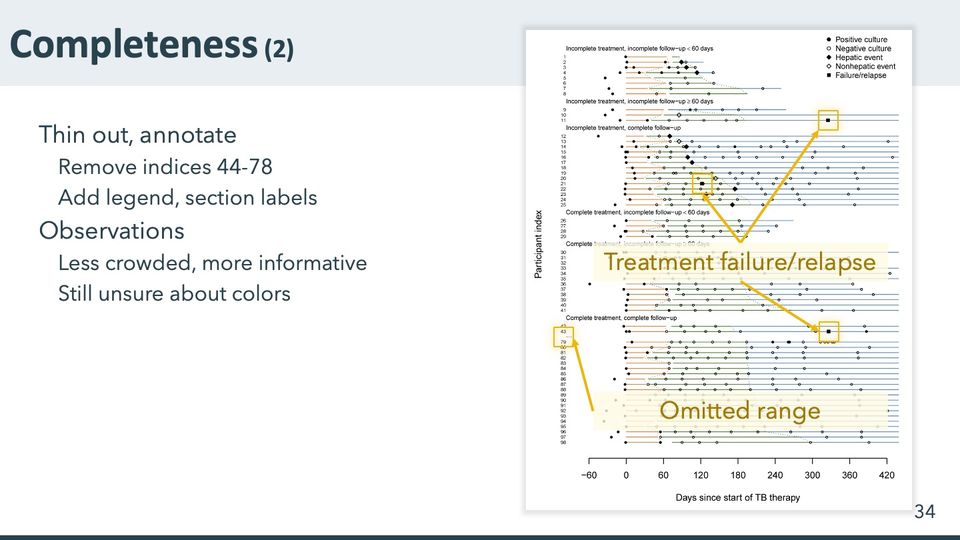
- Panels
- 1
- Elements
- 63 rows, one per participant, each a horizontal line in up to 3 colored segments (orange, then green, then blue); dotted lines join the segment ends across neighboring rows; markers per a 5-entry legend at upper right (filled circle, open circle, filled diamond, open diamond, filled square); no key for the line colors; 6 section labels. Overlaid: 4 yellow squares, 3 around markers with arrows to one callout and one around the row labels at the break, with an arrow to a second callout; the callouts' pale translucent boxes fade 2 bands of rows
- Horizontal
- Days since start of TB therapy, −60 to 420, labeled every 60; data from about −50 to 420
- Vertical
- Participant index, 63 rows numbered 1 to 43 and 79 to 98 from top to bottom, with a short dotted break between 43 and 79; 6 labeled sections of 8, 3, 14, 4, 12 and 22 rows
- Visible pattern
- Compared with the previous slide, the rows are spread into 6 labeled sections with a legend, and the middle of the last section is cut out at a marked break. Orange segments start near 0 and end around 50 to 70 days; green segments end between about 85 and 200 in most rows and later in the bottom few, with the dotted lines tracing their ends. Lines in the top section end by about 200 days and those in the fourth by about 270; in the other sections most rows run to the right edge. Filled circles cluster at and to the left of 0, open circles fall along the lines, and diamonds lie mostly in the top 3 sections between about 70 and 175 days. The 3 squares boxed for the first callout lie near 120 and 330 days. Rows behind the 2 callout boxes are faded.
Text in the picture
Positive culture
Negative culture
Hepatic event
Nonhepatic event
Failure/relapse
Incomplete treatment, incomplete follow-up < 60 days
Incomplete treatment, incomplete follow-up ≥ 60 days
Incomplete treatment, complete follow-up
Complete treatment, incomplete follow-up < 60 days
Complete treatment, incomplete follow-up ≥ 60 days
Complete treatment, complete follow-up
Abbreviations: TB = tuberculosis.
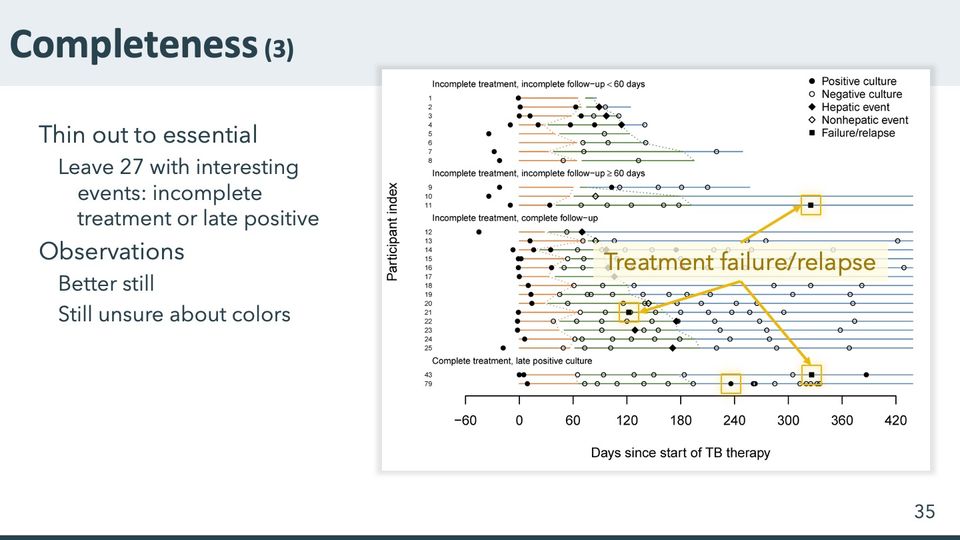
- Panels
- 1
- Elements
- 27 rows, one per participant, each a horizontal line in up to 3 colored segments (orange, then green, then blue); dotted lines join the segment ends across neighboring rows; markers per a 5-entry legend at upper right (filled circle, open circle, filled diamond, open diamond, filled square); no key for the line colors; 4 section labels. Overlaid: 4 yellow squares around markers, 3 of them with arrows to a callout whose pale translucent box fades several rows
- Horizontal
- Days since start of TB therapy, −60 to 420, labeled every 60; data from about −50 to 420
- Vertical
- Participant index, 27 rows numbered 1 to 25, then 43 and 79, from top to bottom, in 4 labeled sections of 8, 3, 14 and 2 rows
- Visible pattern
- Compared with the previous slide, only the first 3 sections remain, followed by a new section of 2 rows that keep their indexes from the last one, and the chart is drawn larger. Orange segments start near 0 and end around 50 to 70 days; green segments end between about 90 and 200, the dotted lines zigzagging between those ends. Blue segments are short or absent in the top section and run to the right edge in most lower rows. Filled circles cluster at and to the left of 0, open circles fall along the lines, and diamonds lie in the upper 3 sections between about 70 and 175 days. Three of the 4 boxed markers are filled squares, near 120 days in the third section and near 330 in the second and last; the fourth is a filled circle near 240 days in the last row.
Text in the picture
Positive culture
Negative culture
Hepatic event
Nonhepatic event
Failure/relapse
Incomplete treatment, incomplete follow-up < 60 days
Incomplete treatment, incomplete follow-up ≥ 60 days
Incomplete treatment, complete follow-up
Complete treatment, late positive culture
Abbreviations: TB = tuberculosis.
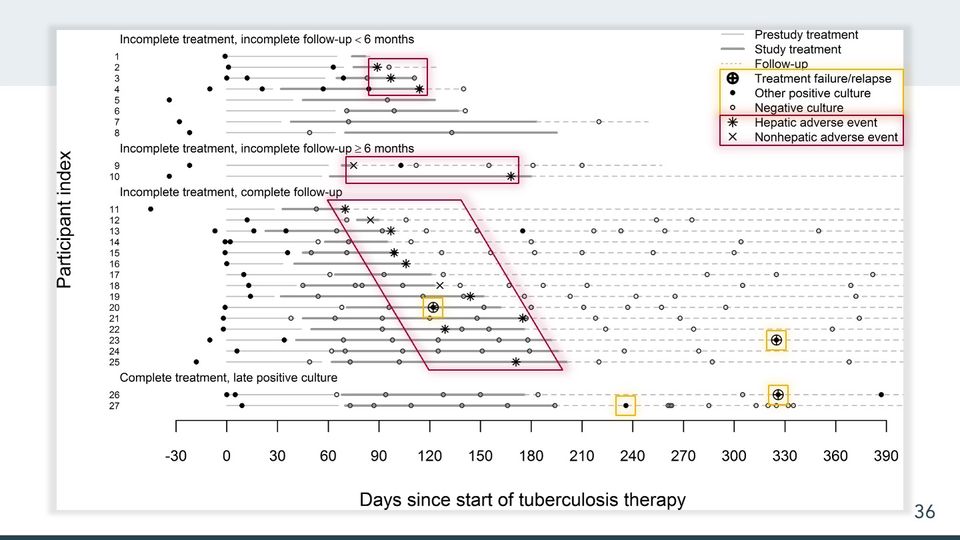
- Panels
- 1
- Elements
- 27 rows, one per participant, each with up to 3 horizontal line segments in the legend's 3 styles (thin light gray, thick gray, dashed light gray), carrying 5 kinds of markers per the legend: circled plus, small filled circle, small open circle, asterisk and x; an 8-entry legend at upper right (3 line styles, 5 markers). Overlaid: 4 yellow squares around markers; 3 red outlined shapes with a soft red glow (2 rectangles and a slanted parallelogram); in the legend, a yellow box around 3 marker entries and a red box around 2
- Horizontal
- Days since start of tuberculosis therapy, −30 to 390, labeled every 30; data from about −45, with dashed follow-up lines running to the right edge, just past 390; no reference lines
- Vertical
- Participant index, 27 rows numbered 1 to 27 from the top, in 4 labeled sections of 8, 2, 15 and 2 rows
- Visible pattern
- Thin lines start at 0 in nearly every row, and thick lines take over between about 30 and 70 days and end between about 70 and 200. Dashed lines end between about 100 and 250 days in the top section and run to the right edge in most rows below. Filled circles cluster at and to the left of 0, and open circles fall along the lines at roughly regular intervals. The red shapes enclose the asterisks and x marks: a small rectangle in the top section around 85 to 120 days, a wider one in the second section from about 70 to 175, and a slanted band through the third section from upper left (about 70 to 140 days) to lower right (about 120 to 195). The yellow squares mark the 3 circled plus signs, near 120 and 325 days, and one filled circle near 235 days in the last row.
Text in the picture
Prestudy treatment
Study treatment
Follow-up
Treatment failure/relapse
Other positive culture
Negative culture
Hepatic adverse event
Nonhepatic adverse event
Incomplete treatment, incomplete follow-up < 6 months
Incomplete treatment, incomplete follow-up ≥ 6 months
Incomplete treatment, complete follow-up
Complete treatment, late positive culture
This graphic underwent dozens of additional revisions. Let’s jump ahead to the final version that was published.
The final graphic retains several characteristics from the late-positives version and modifies or introduces other new features.
The horizontal axis is nearly the same, now demarcated in 30-day increments rather than 28-day.
In addition to pre-study and on-study therapy, this version shows time in follow-up, so as to capture information on patients with incomplete follow-up. Some intermediate versions used color, but the later versions used grayscale both to prepare for submitting to a journal and to ease consideration of viewers’ color perception.
The vertical axis contains index labels, but they enumerate the 27 presented here.
The vertical order is stratified into 4 groups, based on completeness of treatment, duration of follow-up, and presence of late positive culture. This version omits 2 other subgroups (71 participants), so that a reader can focus on the exceptions.
In addition to binary culture status, this version highlights the adjudicated treatment failure (#20) and relapses (23, 26). Participant 27 was determined not to have relapsed, even though they have a positive result a few months after completing treatment.
This version also adds markers for adverse events, distinguished as hepatic or nonhepatic. Several participants appeared to have ended therapy or follow-up when they experienced a hepatic event. A few ended around a nonhepatic event. And the remainder ended without association with any adverse event.
Observations:
This graphic was revised so extensively in part to experiment with tradeoffs between information density and clarity. One coauthor objected to including this graphic in the manuscript. To be fair, since it was reduced in size, even an astute reader might have difficulty discerning fine details. At a decent size, however, I contend that it provides a useful amount of detail in a format that complements (or rivals!) a tabular format.
Reves R, Heilig CM, Tapy JM, Bozeman L, Kyle RP, Hamilton CD, Bock N, Narita M, Wing D, Hershfield E, Goldberg SV, Tuberculosis Trials Consortium. Intermittent tuberculosis treatment for patients with isoniazid intolerance or drug resistance. International Journal of Tuberculosis and Lung Disease. 2014; 18(5): 571–580. DOI: 10.5588/ijtld.13.0304.
Abbreviations: DOI = digital object identifier.

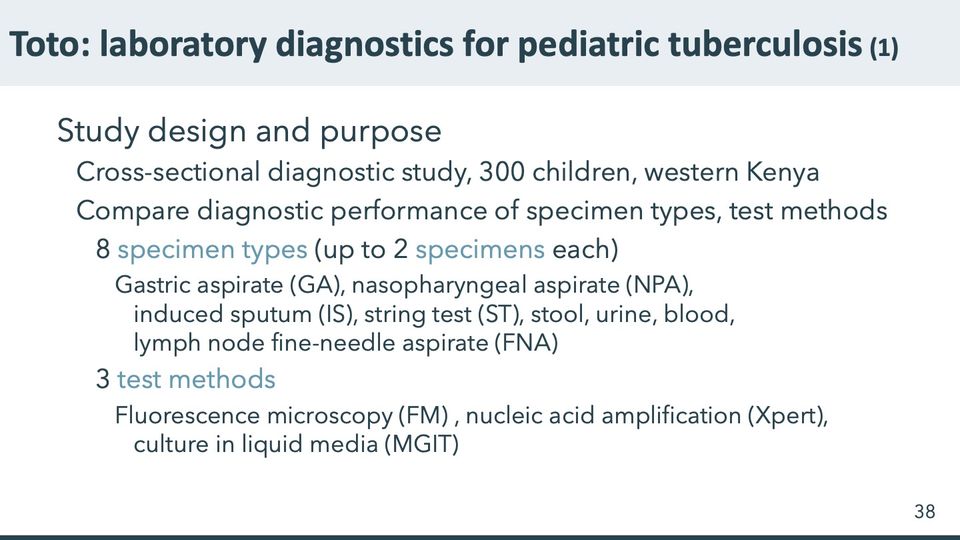
Song R, Click ES, McCarthy KD, Heilig CM, Mchembere W, Smith JP, Fajans M, Musau SK, Okeyo E, Okumu A, Orwa J. Sensitive and feasible specimen collection and testing strategies for diagnosing tuberculosis in young children. JAMA Pediatrics. 2021 May 1;175(5):e206069. doi:10.1001/jamapediatrics.2020.6069
Abbreviations: FM = fluorescence microscopy; FNA = fine-needle aspirate (of a lymph node); GA = gastric aspirate; IS = induced sputum; MGIT = Mycobacteria Growth Indicator Tube (liquid culture system); NPA = nasopharyngeal aspirate; ST = string test (specimen collection method); Xpert = Xpert MTB/RIF (Cepheid GeneXpert cartridge nucleic acid amplification test for TB and rifampicin resistance).
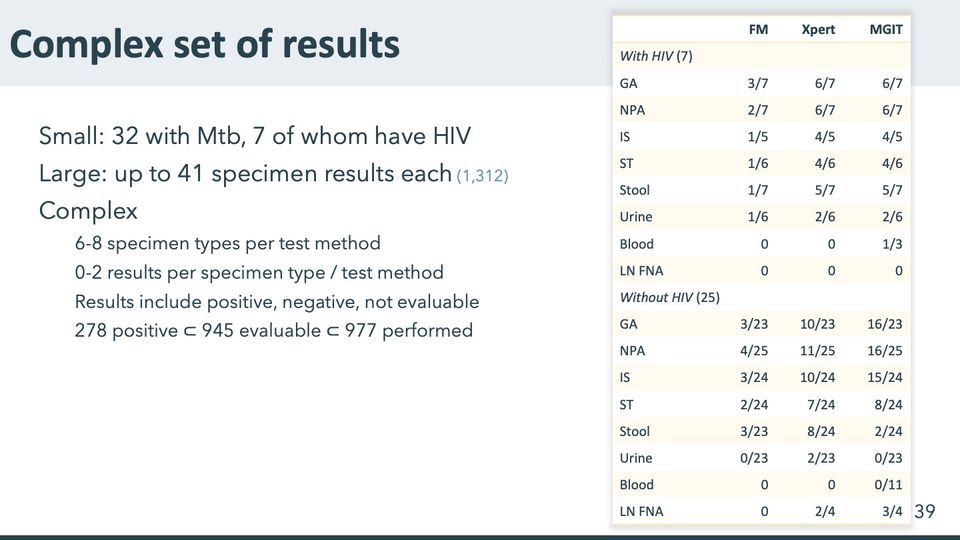
Abbreviations: FM = fluorescence microscopy; FNA = fine-needle aspirate (of a lymph node); GA = gastric aspirate; HIV = human immunodeficiency virus; IS = induced sputum; LN = lymph node; MGIT = Mycobacteria Growth Indicator Tube (liquid culture system); Mtb = Mycobacterium tuberculosis (the bacterium that causes TB); NPA = nasopharyngeal aspirate; ST = string test (specimen collection method); Xpert = Xpert MTB/RIF (Cepheid GeneXpert cartridge nucleic acid amplification test for TB and rifampicin resistance).
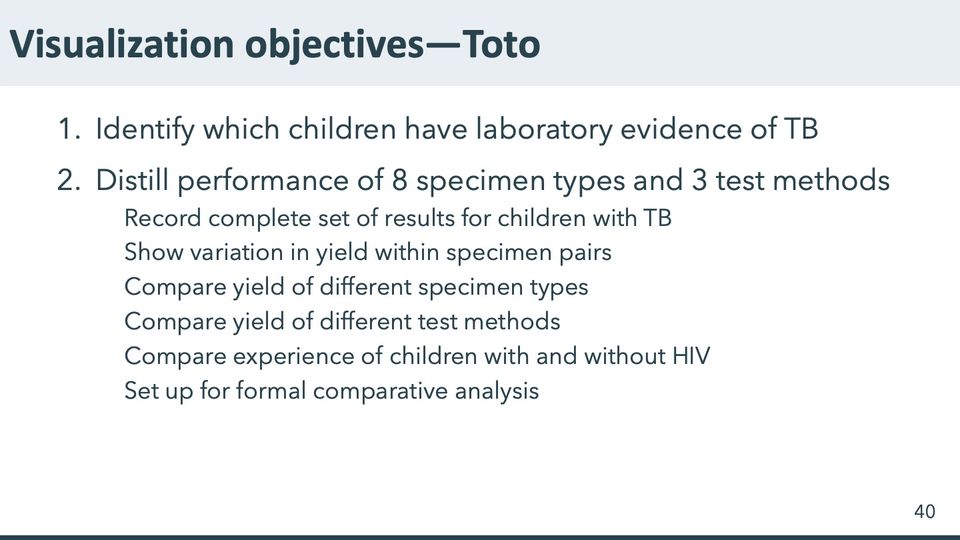
Abbreviations: HIV = human immunodeficiency virus; TB = tuberculosis.
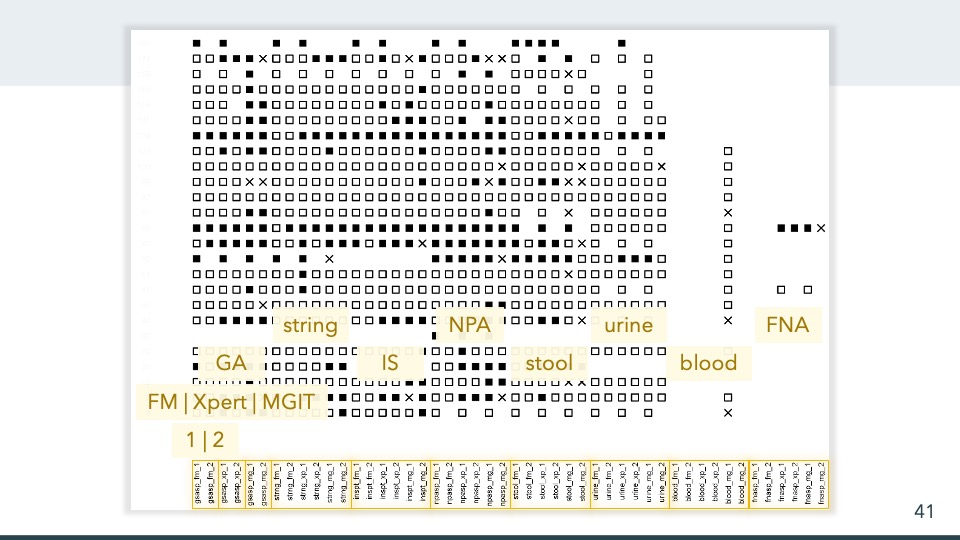
- Panels
- 1
- Elements
- Squares in a grid, 1 per cell, filled black or hollow, and x marks; many cells blank; no legend. Translucent tan boxes laid over the lower rows carry the labels given in the slide text, and gold outlines group the column labels.
- Horizontal
- 48 columns, evenly spaced, with rotated coded labels in 8 groups of 6 by prefix, from left: gsasp, strng, inspt, npasp, stool, urine, blood, fnasp; within each group the labels run fm, xp, mg, each with the suffixes _1 and _2. Gold outlines enclose each group's labels, the gsasp group as 3 pairs; the overlay labels sit above the groups they name.
- Vertical
- About 25 rows, each labeled at left with a number (redacted)
- Visible pattern
- Hollow squares fill most of the first 6 groups of columns. A few rows are mostly filled squares across those groups, and filled squares are scattered through the other rows. Several rows hold marks only in every other column over part of their width, and 1 row near the bottom holds only a few filled squares, partly under an overlay box. The blood group holds marks in only 1 column, mostly hollow squares with a few x marks, down the lower two-thirds of the rows; the fnasp group holds marks in only 2 rows. X marks are few and scattered.
Text in the picture (summary)
Rows labeled with study numbers; 48 columns labeled with rotated variable names.
This graphic was one of my earliest attempts to capture all the essential results, in part to figure out which children had Mtb and how pervasive their positive results were across specimen types and tests.
This graphic contains information for 25 children (vertical dimension, evenly spaced). The columns represent unique combinations of specimen type, test type, and specimen result number. On the lower left [], we see that specimen-result pairs appear side-by-side. Next [], we see that fluorescence microscopy, Xpert (NAA), and MGIT (culture) appear side-by-side. Finally, we see the 8 different specimen types: gastric aspirate (GA), string test (ST), induced sputum (IS), nasopharyngeal aspirate (NPA), stool, urine, blood, and fine-needle aspirate (FNA) of the lymph node. Filled squares are positive, empty squares are negative, and Xs are indeterminate. Where the earlier examples used the horizontal dimension to represent time, this example uses the horizontal dimension to represent nontemporal repeated measures.
Some immediate impressions: Blood results are limited to at most 1 result on MGIT, with only 1 positive result seen here. FNA was performed only when a node was sufficiently enlarged – only 2 children, where the FNA positive on Xpert and MGIT is from a child with positive results on nearly every other specimen type. We could scrutinize this further to glean additional information. But we can also see some substantive design flaws: The even horizontal spacing does us no favors; nor does the blocky nature of the squares. As with the TB trial, we can start to get the sense that vertical order and spacing could be helpful, but it’s not immediately clear how. Unlike the TB trial, the horizonal order and spacing could also be helpful here.
Abbreviations: FM = fluorescence microscopy; FNA = fine-needle aspirate (of a lymph node); GA = gastric aspirate; IS = induced sputum; MGIT = Mycobacteria Growth Indicator Tube (liquid culture system); Mtb = Mycobacterium tuberculosis (the bacterium that causes TB); NAA = nucleic acid amplification; NPA = nasopharyngeal aspirate; ST = string test (specimen collection method); TB = tuberculosis; Xpert = Xpert MTB/RIF (Cepheid GeneXpert cartridge nucleic acid amplification test for TB and rifampicin resistance).
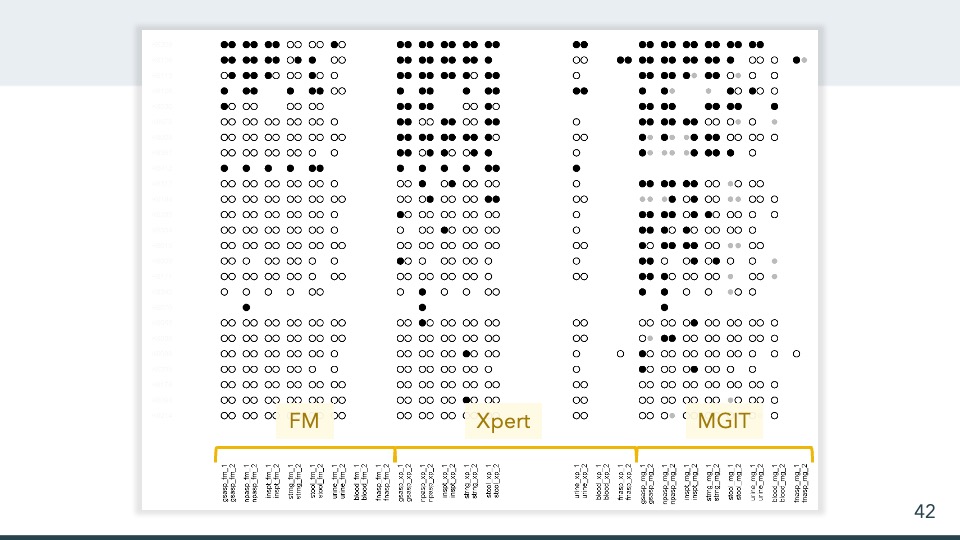
- Panels
- 1
- Elements
- Circles set side by side in pairs, up to 2 per column position, each filled black, hollow, or smaller and light gray; many positions blank or holding a single circle; no legend. Tan boxes laid over the bottom rows carry the block labels given in the slide text.
- Horizontal
- 24 column positions, 8 in each of 3 blocks marked by gold brackets at the bottom and named by the overlay labels. In each block the specimens run gsasp, npasp, inspt, strng, stool, urine, blood, fnasp, and each position carries 2 stacked rotated labels ending _1 and _2. A wide blank gap sits between stool and urine in the Xpert block.
- Vertical
- 25 rows, each labeled at left (redacted); no grouping
- Visible pattern
- Filled circles concentrate in the top rows of all 3 blocks and thin out downward; the lower rows are mostly hollow circles. In the FM block, filled circles appear only in the top 5 rows and 2 rows further down. The Xpert block is dense with filled circles through about the 9th row, with scattered filled circles below. In the MGIT block, filled circles reach further, through about the 18th row, and are scattered below; the gray circles appear only in this block. In FM the blood and fnasp positions are empty, and in Xpert the blood position is empty; the fnasp positions of Xpert and MGIT hold marks in only 2 rows, and the blood position of MGIT holds single circles in about half the rows. Several rows hold single circles rather than pairs, and 1 row is blank except for a single filled circle in each block.
Text in the picture (summary)
Rows labeled with study participant codes; 48 columns labeled with rotated variable names.
2015-02-18
This version was produced within a few weeks of the version on the previous slide. The huge gap in the middle obscures extra specimen results for a substudy. The horizontal scale still places specimen results 1 and 2 next to each other, but now specimen types a grouped before test types. The horizontal space between specimen result pairs helps represent pairs as more closely related than specimen or test types. The horizontal order roughly approximates decreasing sensitivity. The vertical order roughly approximates decreasingly pervasive positive results. The circle plot characters reduce some of the visual clutter, and the gray dots for indeterminate are deemphasized but visually consistent.
Observations: Xpert and MGIT might have similar sensitivity, though MGIT is more prone to indeterminate results because of contamination. GA, N{A, and IS appear most sensitive, with urine and blood showing very low sensitivity. A couple children have very few results that are nonetheless pervasively positive.
Abbreviations: FM = fluorescence microscopy; GA = gastric aspirate; IS = induced sputum; MGIT = Mycobacteria Growth Indicator Tube (liquid culture system); TB = tuberculosis; Xpert = Xpert MTB/RIF (Cepheid GeneXpert cartridge nucleic acid amplification test for TB and rifampicin resistance).
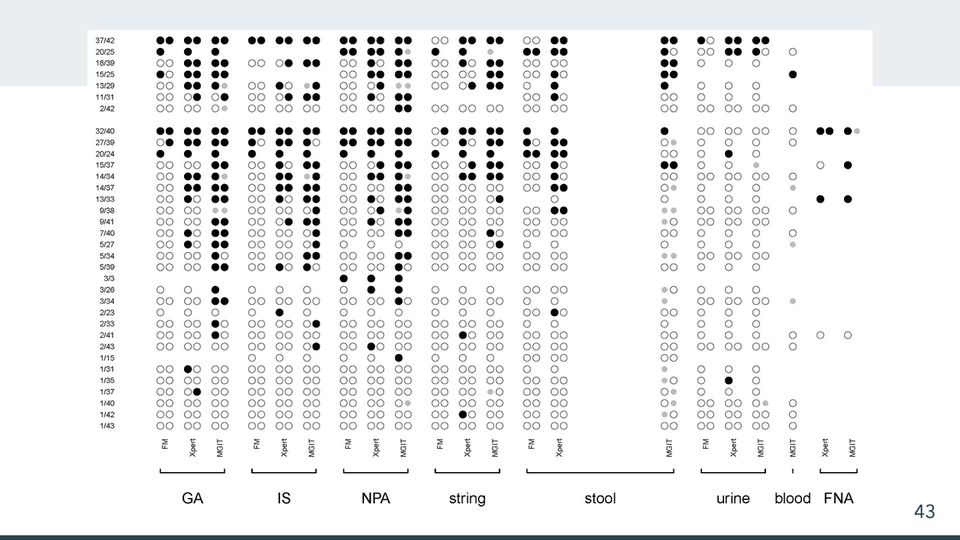
- Panels
- 1
- Elements
- Circles set side by side in pairs, up to 2 per column position, each filled black, hollow, or smaller and light gray; some positions blank or holding a single circle; no legend.
- Horizontal
- 21 column positions in 8 bracketed groups labeled beneath, from left GA, IS, NPA, string, stool, urine, blood, FNA; within each group rotated labels name the tests, FM, Xpert and MGIT. GA, IS, NPA, string, stool and urine have all 3, stool with a wide blank gap before MGIT; blood has MGIT only; FNA has Xpert and MGIT.
- Vertical
- 34 rows in 2 groups separated by a gap, 7 above and 27 below, each labeled at left with a fraction; within each group the numerators descend from top to bottom (37 to 2 above, 32 to 1 below).
- Visible pattern
- In both groups filled circles are dense in the top rows and thin out downward; the lowest rows of the lower group are almost entirely hollow circles. The GA, IS, NPA and string groups hold most of the filled circles, more often in their Xpert and MGIT columns than in FM, where filled circles appear only in the top few rows of each group. The stool and urine groups are mostly hollow circles below their top several rows. The blood column holds single circles in about half the rows, and the FNA columns hold marks in only 4 rows. Gray circles are few and appear mostly in MGIT columns, most of all in stool MGIT. A few rows hold single circles rather than pairs, and 1 row in the lower group holds only 3 filled circles, all in the NPA group.
Text in the picture
37/42
20/25
18/39
15/25
13/29
11/31
2/42
32/40
27/39
20/24
15/37
14/34
14/37
13/33
9/38
9/41
7/40
5/27
5/34
5/39
3/3
3/26
3/34
2/23
2/33
2/41
2/43
1/15
1/31
1/35
1/37
1/40
1/42
1/43
FM Xpert MGIT (GA, IS, NPA, string, stool, urine)
MGIT (blood)
Xpert MGIT (FNA)
GA IS NPA string stool urine blood FNA
2016-04-27
This version was produced more than a year after the version on the previous slide, though there were many iterations in between. This version has more informative annotations – specimen and test type on in the horizontal extent, number of positive and evaluable specimens in the vertical extent. In contrast to the previous version, this one groups test types within specimen types. It also stratifies by HIV status, although this is not labeled on the graph. The positive specimen results stand out even more, because the negative specimen results are open gray circles rather than open black.
Observation: This grouping might help better understand urine, blood, and FNA. But because of the relatively low yield on microscopy, it tends to obscure comparisons between higher yield specimen types. The labels on the left are somewhat informative, but they mix all the specimen and test types.
Abbreviations: FM = fluorescence microscopy; FNA = fine-needle aspirate (of a lymph node); HIV = human immunodeficiency virus; IS = induced sputum; MGIT = Mycobacteria Growth Indicator Tube (liquid culture system); NPA = nasopharyngeal aspirate; TB = tuberculosis; Xpert = Xpert MTB/RIF (Cepheid GeneXpert cartridge nucleic acid amplification test for TB and rifampicin resistance).
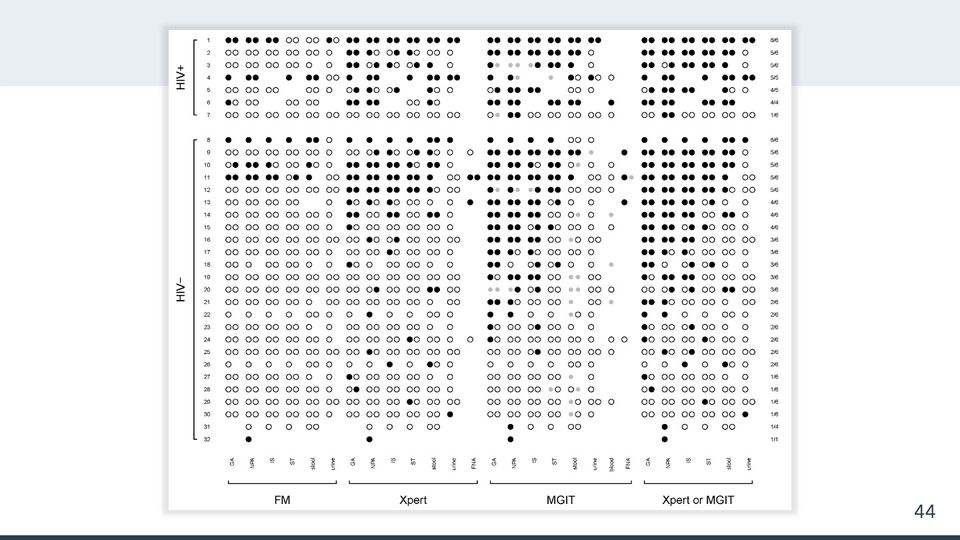
- Panels
- 1
- Elements
- Circles set side by side in pairs, up to 2 per column position, each filled black, hollow, or smaller and light gray; some positions blank or holding a single circle; a column of fractions at the far right; no legend.
- Horizontal
- 27 column positions in 4 bracketed blocks labeled beneath, from left FM (6: GA, NPA, IS, ST, stool, urine), Xpert (7, adding FNA), MGIT (8, adding blood and FNA) and Xpert or MGIT (6); rotated column labels; a column of fractions at the right edge.
- Vertical
- 32 rows numbered 1 to 32, in 2 bracketed groups separated by a gap: HIV+ (rows 1 to 7) and HIV− (rows 8 to 32).
- Visible pattern
- In each group the right-hand fractions descend from 6/6 at the top to 1/6 or 1/1 at the bottom, and filled circles thin out from top to bottom in step. Within each block, filled circles reach further down in the left-hand columns than in the right-hand ones, so they gather toward the upper left and hollow circles toward the lower right. The FM block is mostly hollow circles except in the top few rows of each group. The Xpert block has more filled circles, and the MGIT and Xpert or MGIT blocks have the most, reaching about two-thirds of the way down the HIV− group in their left-hand columns. Gray circles appear only in the MGIT block. The blood and FNA columns hold marks in only a few rows, and the last 2 rows hold only a few marks each.
Text in the picture
HIV+
HIV−
FM: GA NPA IS ST stool urine
Xpert: GA NPA IS ST stool urine FNA
MGIT: GA NPA IS ST stool urine blood FNA
Xpert or MGIT: GA NPA IS ST stool urine
Right column, rows 1 to 7: 6/6, 5/6, 5/6, 5/5, 4/5, 4/4, 1/6
Right column, rows 8 to 32: 6/6, 5/6, 5/6, 5/6, 5/6, 4/6, 4/6, 4/6, 3/6, 3/6, 3/6, 3/6, 3/6, 2/6, 2/6, 2/6, 2/6, 2/6, 2/6, 1/6, 1/6, 1/6, 1/6, 1/4, 1/1
2019-05-28
This nearly final version reverts to grouping by test type first, and it introduces the composite of Xpert an MGIT. The axis annotations are clean and simple (though the HIV labels violate a Tufte admonition). As with the TB trial graphic, this graphic includes participant indices specific to this graphic rather than the overall study, which provides a hook for discussion in the manuscript and supplement. With the composite test results, the right-hand side now shows the number of specimen types that are positive and the number evaluable, which becomes a leading measure of yield for each child. Now we can see that the children are sorted first by HIV status, then by the number of evaluable specimen types, and finally the number of specimen types with at least 1 positive result. Now the filled circles roughly trace an upper left triangle, and the open circles roughly trace a lower right triangle.
Abbreviations: FM = fluorescence microscopy; FNA = fine-needle aspirate (of a lymph node); GA = gastric aspirate; HIV = human immunodeficiency virus; HIV+ = HIV-positive; MGIT = Mycobacteria Growth Indicator Tube (liquid culture system); NPA = nasopharyngeal aspirate; TB = tuberculosis; Xpert = Xpert MTB/RIF (Cepheid GeneXpert cartridge nucleic acid amplification test for TB and rifampicin resistance).
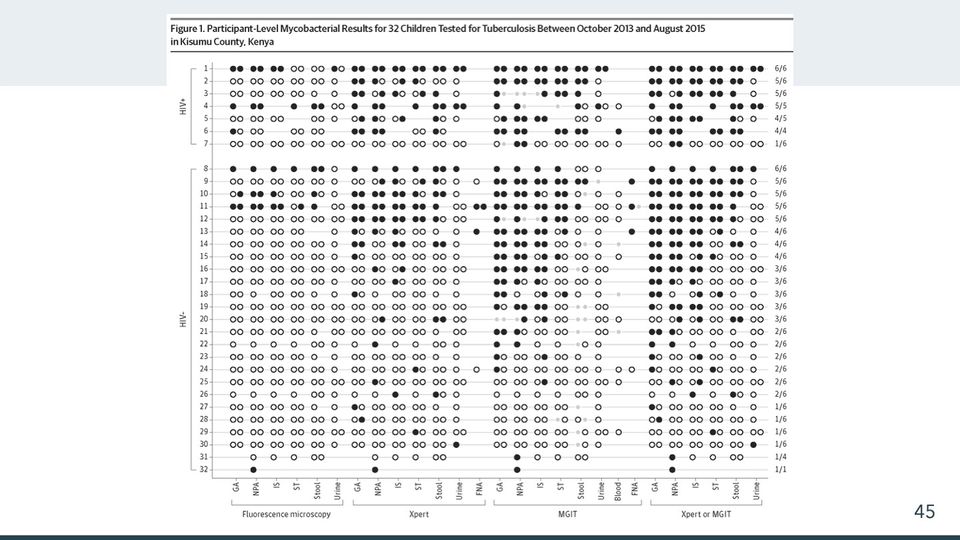
- Panels
- 1
- Elements
- Circles set side by side in pairs, up to 2 per column position, each filled black, hollow, or smaller and light gray; some positions blank or holding a single circle; thin gray lines run along each row from the row number to a fraction at the far right; no legend.
- Horizontal
- 27 column positions in 4 bracketed blocks labeled beneath, from left Fluorescence microscopy (6: GA, NPA, IS, ST, Stool, Urine), Xpert (7, adding FNA), MGIT (8, adding Blood and FNA) and Xpert or MGIT (6); rotated column labels with tick marks; a column of fractions at the right edge.
- Vertical
- 32 rows numbered 1 to 32 with tick marks, in 2 bracketed groups separated by a gap: HIV+ (rows 1 to 7) and HIV- (rows 8 to 32).
- Visible pattern
- In each group the right-hand fractions descend from 6/6 at the top to 1/6 or 1/1 at the bottom, and filled circles thin out from top to bottom in step. Within each block, filled circles reach further down in the left-hand columns than in the right-hand ones, so they gather toward the upper left and hollow circles toward the lower right. The Fluorescence microscopy block is mostly hollow circles except in the top few rows of each group. The Xpert block has more filled circles, and the MGIT and Xpert or MGIT blocks have the most, reaching about two-thirds of the way down the HIV- group in their left-hand columns. Gray circles appear only in the MGIT block. The blood and FNA columns hold marks in only a few rows, and the last 2 rows hold only a few marks each.
Text in the picture
Figure 1. Participant-Level Mycobacterial Results for 32 Children Tested for Tuberculosis Between October 2013 and August 2015
in Kisumu County, Kenya
HIV+
HIV-
Fluorescence microscopy: GA NPA IS ST Stool Urine
Xpert: GA NPA IS ST Stool Urine FNA
MGIT: GA NPA IS ST Stool Urine Blood FNA
Xpert or MGIT: GA NPA IS ST Stool Urine
Right column, rows 1 to 7: 6/6, 5/6, 5/6, 5/5, 4/5, 4/4, 1/6
Right column, rows 8 to 32: 6/6, 5/6, 5/6, 5/6, 5/6, 4/6, 4/6, 4/6, 3/6, 3/6, 3/6, 3/6, 3/6, 2/6, 2/6, 2/6, 2/6, 2/6, 2/6, 1/6, 1/6, 1/6, 1/6, 1/4, 1/1
The is the final, published version. On acceptance, JAMA Pediatrics insisted on redrawing the graphic. The published version preserved more detail than I’d expected, with the following changes: They added horizontal lines, which aid in tracking individual children but also give the graphic the feel of an abacus. They added axis lines on the left and bottom. And they changed some spelling. But they also improved the scale of the axis annotations relative to the rest of the graphic.
Published caption: “Dot plot of participant-level results for fluorescence microscopy, Xpert MTB/RIF (Cepheid), and mycobacteria growth indicator tube (MGIT) by sample type and sample number. Up to 2 samples of each type were tested per participant. Black circles indicate a positive result, gray circles indicate an invalid (Xpert MTB/RIF) or contaminated (MGIT) result, and white circles indicate a negative result. The top 7 rows are results for participants with HIV. The column on the right shows the number of positive results by Xpert MTB/RIF or MGIT over the number of evaluable specimens. Participants are sorted vertically in descending order of number of testing results available. FNA indicates fine-needle aspiration; GA, gastric aspirate; IS, induced sputum; NPA, nasopharyngeal aspirate; ST, string test.”
Song R, Click ES, McCarthy KD, Heilig CM, Mchembere W, Smith JP, Fajans M, Musau SK, Okeyo E, Okumu A, Orwa J. Sensitive and feasible specimen collection and testing strategies for diagnosing tuberculosis in young children. JAMA Pediatrics. 2021 May 1;175(5):e206069. doi:10.1001/jamapediatrics.2020.6069
Abbreviations: FNA = fine-needle aspirate (of a lymph node); GA = gastric aspirate; HIV = human immunodeficiency virus; HIV+ = HIV-positive; IS = induced sputum; MGIT = Mycobacteria Growth Indicator Tube (liquid culture system); MTB = Mycobacterium tuberculosis (the bacterium that causes TB); NPA = nasopharyngeal aspirate; RIF = rifampicin (rifampin) resistance; ST = string test (specimen collection method); TB = tuberculosis; Xpert = Xpert MTB/RIF (Cepheid GeneXpert cartridge nucleic acid amplification test for TB and rifampicin resistance).




Abbreviations: DOI = digital object identifier; HIV = human immunodeficiency virus; ISBN = International Standard Book Number.

Text in the picture
CDC
Abbreviations: CDC = Centers for Disease Control and Prevention.


Business English for Success https://saylordotorg.github.io/text_business-english-for-success/s16-revising-and-presenting-your-w.html
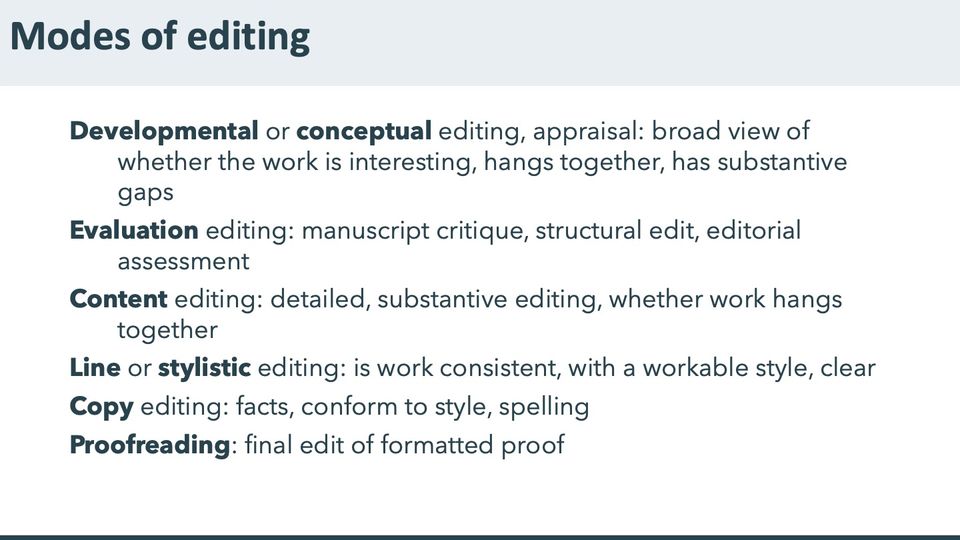
synthesized from several similar sources

27 Book Editors Share Their Editing Top Tips and Naughty No-Nos, updated 2021-11-29
https://www.emmalombardauthor.com/post/27-book-editors-share-their-editing-top-tips-and-naughty-no-nos
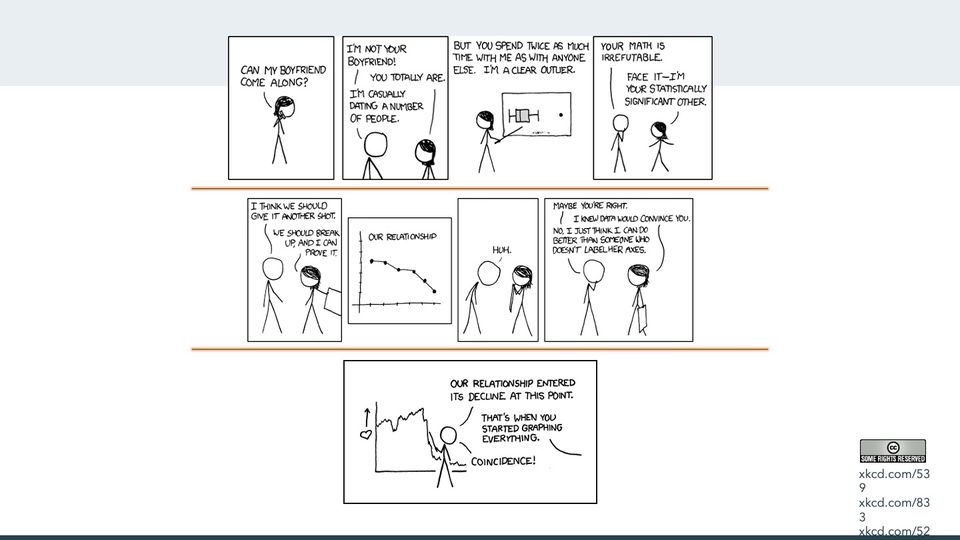
xkcd strips 539 ("Boyfriend"), 833 ("Convincing"), and 523 ("Decline")

Abbreviations
AB = abnormal biopsy; ATSDR = Agency for Toxic Substances and Disease Registry; C1 = cervical intraepithelial neoplasia grade 1; C3 = cervical intraepithelial neoplasia grade 3; CDC = Centers for Disease Control and Prevention; CIN = cervical intraepithelial neoplasia; Cnos = cervical intraepithelial neoplasia, not otherwise specified; DOI = digital object identifier; Dx = diagnosis; FM = fluorescence microscopy; FNA = fine-needle aspirate (of a lymph node); GA = gastric aspirate; HER/HERS = HIV Epidemiology Research (HER) Study; HIV = human immunodeficiency virus; HIV+ = HIV-positive; HP = condyloma; IS = induced sputum; ISBN = International Standard Book Number; LN = lymph node; MGIT = Mycobacteria Growth Indicator Tube (liquid culture system); Mtb = Mycobacterium tuberculosis (the bacterium that causes TB); MTB = Mycobacterium tuberculosis (the bacterium that causes TB); NAA = nucleic acid amplification; NO = normal biopsy; NPA = nasopharyngeal aspirate; RIF = rifampicin (rifampin) resistance; SIL = squamous intraepithelial lesion; SIL+ = squamous intraepithelial lesion; ST = string test (specimen collection method); TB = tuberculosis; TBTC = Tuberculosis Trials Consortium (CDC-sponsored); Tx = treatment; UK = unknown biopsy; VST = visit; Xpert = Xpert MTB/RIF (Cepheid GeneXpert cartridge nucleic acid amplification test for TB and rifampicin resistance).
References, compiled for this page
Full citations, with current links, for selected references and related works.
- Paramsothy P, Duerr A, Heilig CM, Cu-Uvin S, Anderson JR, Schuman P, Klein RS. Abnormal vaginal cytology in HIV-infected and at-risk women after hysterectomy. JAIDS J. Acquir. Immune Defic. Syndr. 2004;35(5):484–491. DOI: 10.1097/00126334-200404150-00006.
- Reves R, Heilig CM, Tapy JM, Bozeman L, Kyle RP, Hamilton CD, Bock N, Narita M, Wing D, Hershfield E, et al. Intermittent tuberculosis treatment for patients with isoniazid intolerance or drug resistance. Int. J. Tuberc. Lung Dis. 2014;18(5):571–580. DOI: 10.5588/ijtld.13.0304.
- Song R, Click ES, McCarthy KD, Heilig CM, Mchembere W, Smith JP, Fajans M, Musau SK, Okeyo E, Okumu A, et al. Sensitive and feasible specimen collection and testing strategies for diagnosing tuberculosis in young children. JAMA Pediatr. 2021;175(5):e206069. DOI: 10.1001/jamapediatrics.2020.6069.