Speeding Up Public Health Science: Reducing Processing Time under the Paperwork Reduction Act
On this work — Chad Heilig
My colleague, Lisa M Lee, and I wrote the OMB-time-in-process methods and results into manuscript form so that we could share it with other scholars of administrative methodology. The version provided here was our fifth and final attempt — not accepted — to get it published. Some reviews were deemed out of scope, other reviews found it too parochial. Nonetheless, the work is in the public domain.
Version date · 2012
Government Information Quarterly (submitted)
Authors: Charles M Heilig, PhD (corresponding author) — Mathematical Statistician, Division of Tuberculosis Elimination, US Centers for Disease Control and Prevention; Lisa M Lee, PhD, MS — Chief Science Officer, Office of Surveillance, Epidemiology, and Laboratory Services, US Centers for Disease Control and Prevention
Venue: Government Information Quarterly (submitted 2012-02-24, manuscript GIQ-S-12-00054; declined, not accepted for publication)
Abstract
The Paperwork Reduction Act imposes time-intensive regulatory requirements on federal agencies that collect information from the public. The authors analyzed the time for the Centers for Disease Control and Prevention (CDC) to obtain required internal and external approvals for 536 information collection requests conducted or sponsored by the CDC between October 2003 and September 2009. The total average processing time peaked at 454 days in fiscal year 2006 and fell to 353 days in fiscal year 2009. The internal CDC portion of the review process peaked at 359 days in fiscal year 2006 and decreased to 244 days in fiscal year 2009. The portion of the review external to CDC added 154 days in fiscal year 2008 and 109 days in fiscal year 2009. CDC used early portions of this analysis to hone internal processes. Further reduction is needed that will maintain the underlying principles of accountability and transparency.
Highlights
- Federal agencies that collect information must follow the Paperwork Reduction Act.
- We analyzed the time obtain required approvals at one federal agency.
- Internal review peaked at 359 days in 2006 and fell to 244 days in 2009.
- External review added 154 days in 2008 and 109 days in 2009.
- Further reduction is needed that will maintain accountability and transparency.
Introduction
The Paperwork Reduction Act affects all entities that collect data conducted or sponsored by the US government, including state, local, and territorial health agencies in the United States, as well as public health collaborators in academic and private sectors. The Paperwork Reduction Act requires a lengthy, resource-intensive process to obtain approval from the Office of Management and Budget (OMB). In public health, information collections include research activities as well as nonresearch activities such as surveillance and program evaluation. Some authors have characterized Paperwork Reduction Act as “impeding research and evaluation in public health.” (Blank, Sullivan, and Lombardo 2009)
First enacted in 1980 (Rubenstein 1990), with roots extending back to 1942 (Relyea 2000), the Paperwork Reduction Act charges the Office of Information and Regulatory Affairs in the Office of Management and Budget with the responsibility to assure that collections of information from the public reflect a minimum burden to individuals, that information collected is used for the greatest practical utility, and that the cost of collecting information is reduced to the minimum (5 CFR 1320). For example, the Centers for Disease Control and Prevention (CDC) and the Agency for Toxic Substances and Disease Registry (ATSDR) impose an estimated 6.8 million burden-hours on the public each year. This burden is a small part of the 513 million hours imposed by the Department of Health and Human Services and the 9.8 billion hours across all covered federal agencies (www.reginfo.gov, 2010-02-12). Overall, less than 1 percent of the federal burden hours are due to research (GAO 2002).
In late 2009, the United States Office of Management and Budget solicited public comments on the implementation of the Paperwork Reduction Act, specifically including “unintended consequences of the administration of the Act, including delays in the conduct of surveys and research in contexts in which citizens are asked, but not required, to respond to information collection requests by the Federal Government.” (www.federalregister.gov 2009) The Office of Management and Budget received 82 public comments in response to this request, 9 of which were from public health officials. (www.regulations.gov 2009) The Office of Management and Budget also received comments from federal agencies. Comments from CDC/ATSDR (henceforth CDC) were informed by an ongoing analysis, presented in this manuscript, of CDC’s internal processes.
This analysis applied rigorous epidemiological methods to administrative data in order to quantify the time needed for Paperwork Reduction Act review and approval, which affects the timeliness of some CDC science and practice activities. Specifically, the authors analyzed the time it takes to review and clear an information collection request from its arrival in the CDC’s Office of the Director (CDC-OD) through disposition by the Office of Management and Budget. This approach used solid evidence to evaluate the duration of the information collection request review process over fiscal years 2004–2009, both inside and outside CDC. The results can be used for two key purposes: First, by measuring the duration of internal processes, CDC can identify ways to increase efficiency through improvements in those processes. Second, by characterizing the duration of external processes, CDC can better plan to accommodate the time taken for those portions of review under Paperwork Reduction Act. Both purposes are important to CDC investigators and partners, as together the internal and external review processes delay starting their project. Improvements in these administrative processes have the potential to improve CDC’s service to the public health community and the broader public. Both purposes are important to CDC investigators and partners, as together the internal and external review processes delay starting their project. Improvements in these administrative processes have the potential to improve CDC’s service to the public health community and the broader public. Both purposes are important to CDC investigators and partners, as together the internal and external review processes delay starting their project. Improvements in these administrative processes have the potential to improve CDC’s service to the public health community and the broader public.
[Note: the preceding sentence pair repeats three times verbatim in the source document — preserved faithfully as an artifact of the submitted manuscript.]
Methods
The unit of this analysis is the information collection request, which might, for example, cover mandatory surveillance reporting from public health departments, information collected under CDC regulations on select agents or quarantine and inspection, or surveys and focus groups conducted as part of research activities. This analysis included administrative data on 536 information collection requests, representing all 378 information collection projects conducted or sponsored by CDC between October 2003 and September 2009. More than one information collection request can exist for a single project. Each information collection request must undergo a sequence of events before the Office of Management and Budget concludes review and potentially permits the agency to move ahead with the information collection. The analysis considered 6 segments of the overall review process, marked by transitions at the following 7 events (Figure 1):
FRN: The CDC program (generically referred to as a National Center, or CDC-NC) submits the draft 60-day Federal Register notice (FRN) to the Office of the CDC Director (CDC-OD).
Public: The Federal Register publishes the 60-day FRN. During this period open to public comment, the CDC-NC finalizes the information collection request for submission to CDC-OD.
CDC-NC: The 60-day public comment period closes. The CDC-NC should submit the information collection request to CDC-OD as soon as possible after the end of public comment.
CDC-OD: The CDC-NC submits the information collection request to CDC-OD, where internal reviewers correspond with CDC-NC staff to resolve concerns. This segment’s duration depends on both the efficiency of review and the responsiveness of the CDC-NC.
HHS: CDC-OD transmits the information collection request to the Department of Health and Human Services (HHS) Office of the Chief Information Officer, where reviewers correspond with CDC staff to resolve concerns.
OMB: HHS transmits the information collection request to the Office of Management and Budget, where reviewers correspond with CDC staff to resolve concerns. Regulations (5 CFR 1320.10(b)) allow 60 days for review.
Concluded: the Office of Management and Budget renders a disposition.
Figure 1. Key events and stages in Paperwork Reduction Act review process.

CDC: Centers for Disease Control and Prevention. CDC-NC: CDC National Center. CDC-OD: CDC Office of the Director. FRN: Federal Register Notice. FR: Federal Register. HHS: Department of Health and Human Services. OMB: Office of Management and Budget.
Structured description: A horizontal event-and-stage timeline diagram. Top axis is divided into two labeled spans (“Stages within CDC” and “Stages outside CDC”) separated by a marker. Below, a row labeled “Stages” names 6 segments in order: FRN, Public, NC, ICRO (CDC-OD), HHS, OMB. Below that, a row labeled “Events” shows 7 boxed events connected by arrows, in sequence: ICRO receives 60-day FRN → FR publishes 60-day notice → Public comment period ends → NC submits ICR to ICRO → ICRO transmits ICR to HHS → HHS transmits ICR to OMB → OMB concludes review. (Note: the figure uses “ICRO” for what the body text calls “CDC-OD,” i.e., the CDC Office of the Director — an internal figure/text labeling variant preserved as-is.)
Using internal tracking data, the authors selected all information collection request review segments that began between 2003-10-05 and 2009-09-26 and collected process data through 2009-12-26, yielding approximately 75 months of data. For some information collection requests, this scheme captured a portion of the overall process, because either the total process began before 2003-10-05, or the process was incomplete as of 2009-12-26, or because crucial intermediate dates were missing. As described later in this section, the analytic methods accounted for incomplete data. For quality control on data, these projects were matched with data from public sources at the Office of the Federal Register and the Office of Information and Regulatory Affairs.
This portion of the data construction yielded 1 or more sets of dates per project. A project had more than 1 set of dates if the 60-day or the 30-day Federal Register notice was republished before the Office of Management and Budget would accept the submission, or if there were 2 or more information collection requests for that project within the scope of the analysis. This data structure contained 1 record for each stage of review. An information collection request that proceeded once through all stages of review contributed 6 records. An information collection request that repeated stages, such as republication of the 60-day Federal Register notice, had a separate record for each time a stage was entered. An information collection request that had not entered a particular stage had no record for that stage. For example, an information collection request that had not yet been submitted to the Office of Management and Budget did not contribute a record for the OMB stage.
Each record included information on the stage of review, the date that stage was entered, and the number of days in that stage. A status indicator reflected whether the stage was exited successfully by moving to the next stage. Upon exiting the stage successfully, the number of days was the difference between the entry date and the exit date. When no successful exit was recorded, for example because a submission was withdrawn from consideration, the time in that stage was right-censored, meaning that successful exit did not occur before the censoring event.
The leading indicator of administrative efficiency was the mean time in each stage of review, based on the duration between key events. In some cases, duration information was only partially recorded. Thus, the statistical analysis employed standard time-to-event methods that accommodated partial information, specifically a combination of the Kaplan-Meier product-limit estimator and Cox proportional hazards regression models for estimating and describing the distribution of time between events. This allowed maximal use of available data, improving the robustness of the analysis. These methods, common in epidemiological applications, had not been previously applied to CDC’s internal administrative processes.
Times in stage were initially modeled using the Kaplan-Meier product-limit estimator, stratified by fiscal year entering the stage, information collection request type, or fiscal year and request type combined. (In the US federal government, a fiscal year [FY] runs from October of one year through September of the following year. FY 2004 started on 2003-10-01 and ended 2004-09-30.) Summary statistics were computed from these survival estimates, including the 10th, 25th, 50th, 75th, and 90th centiles, along with the restricted mean and its standard error. We report the restricted mean (Karrison 1997) to mitigate the statistical influence of exceptionally long durations and to support more appropriate comparisons between earlier and later years. For product-limit estimate \(\hat{S}_{s,u}(t)\) in stage s and fiscal year y, the restricted mean is
\[\hat{T}_{s,y} = \int_{0}^{\tau} \hat{S}_{s,y}(u)\, du\]
where we set τ to 273 days, or about 9 months, as an upper bound on a reasonable duration for the longest review stages.
To permit adjustment for information collection request type, a proportional-hazard regression model was constructed with log-hazard
\[\log\!\left(\lambda_{s,u,y}(t)\right) = \log\!\left(\lambda_{0,s}(t)\right) + \beta_{s,y} + \gamma_{s,u}\]
where λ0,s is the baseline hazard function, βs,y is the log-hazard term for fiscal year y, and γs,u is the log-hazard term for information collection type u. To facilitate comparisons, the mixture of information request types was standardized to a 60:15:25 ratio (the approximate ratio observed in the full dataset), by letting
\[\hat{\gamma}_s = 0.60\,\hat{\gamma}_{s,1} + 0.15\,\hat{\gamma}_{s,2} + 0.25\,\hat{\gamma}_{s,3}.\]
If the baseline survival is \(\hat{S}_{0,s} = \exp\!\left[-\int \hat{\lambda}_{0,s}\right]\), then the associated survival estimate may be written as
\[\hat{S}_{s,y}(t) = \left[\hat{S}_{0,s}(t)\right]^{\exp\left(\hat{\beta}_{s,y} + \hat{\gamma}_s\right)}.\]
A time-in-process index for each fiscal year was then computed by summing the stage-specific restricted means:
\[U_y = \sum_{s} \hat{T}_{s,y} = \sum_{s} \int_{0}^{\tau} \hat{S}_{s,y}(u)\, du.\]
Visual diagnostics were performed by comparing survival curves from proportional hazards and Kaplan-Meier product-limit estimators, as well as numerical comparison of summary statistics of interest.
A corresponding model replaced entry year with entry day, using P-splines (Eilers and Marx 1996) to create flexible functions g of entry day:
\[\log\!\left(\lambda_{s,u,d}(t)\right) = \log\!\left(\lambda_{0,s}(t)\right) + g_s(d) + \gamma_{s,u}\]
\[\hat{S}_{s,d}(t) = \left[\hat{S}_{0,s}(t)\right]^{\exp\left(g_s(d) + \hat{\gamma}_s\right)}\]
The date-specific time-in-process index is
\[U_d = \sum_{s} \hat{T}_{s,d} = \sum_{s} \int_{0}^{\tau} \hat{S}_{s,d}(u)\, du.\]
All models were fit using R (R Development Core Team 2010), especially the survival package (Therneau and Lumley 2010), which was based largely on the monograph by Therneau and Grambsch (2000).
Results
For the 6 fiscal years under review, the authors extracted data on 378 projects covering 536 information collection requests, of the following request types:
| Count | Request type |
|---|---|
| 320 | New collection (request for a new Office of Management and Budget control number) |
| 99 | Revision of a currently approved collection |
| 40 | Reinstatement with change of a previously approved collection |
| 62 | Extension without change of a currently approved collection |
| 11 | Reinstatement without change of a previously approved collection |
| 4 | Existing collection in use without an Office of Management and Budget Control Number |
These request types cover all types reviewed by the Office of Management and Budget in the period under consideration except for the type designated as “No material or nonsubstantive change to a currently approved collection.” This analysis combined the second and third types above into 139 “revisions” and the fourth, fifth, and sixth types into 77 “extensions”. The mixture of information collection request types varies considerably across subgroups of the data, such as fiscal year and organizational unit (data not shown). To facilitate comparisons and adjust for varying mixtures of information collection request types, estimates were standardized to the mixture of information collection request types observed in the entire dataset.
The analysis includes transition times through 2099 distinct stages (excluding the public comment stage; see Table 1), with 396–453 transitions into each stage. The number of stages observed varied from 277 in fiscal year 2006 to 428 in fiscal year 2004.
Table 1. Number of information collection requests contributing to the analysis of each fiscal year and stage.
| Fiscal year | FRN | CDC-NC | CDC-OD | HHS | OMB | Total | % censored |
|---|---|---|---|---|---|---|---|
| 2004 | 72 | 89 | 89 | 88 | 90 | 428 | 0.9 |
| 2005 | 64 | 61 | 71 | 60 | 64 | 320 | 3.1 |
| 2006 | 74 | 69 | 46 | 43 | 45 | 277 | 4.7 |
| 2007 | 89 | 88 | 81 | 72 | 65 | 395 | 6.8 |
| 2008 | 60 | 66 | 64 | 74 | 80 | 344 | 4.1 |
| 2009 | 84 | 80 | 60 | 59 | 52 | 335 | 7.5 |
| Total | 443 | 453 | 411 | 396 | 396 | 2099 | 4.4 |
CDC: Centers for Disease Control and Prevention. CDC-NC: CDC National Center. CDC-OD: CDC Office of the Director. FRN: Federal Register Notice. FR: Federal Register. HHS: Department of Health and Human Services. OMB: Office of Management and Budget.
Censoring in stage CDC-NC ranged from 2.2% in FY 2004 to 23.8% in FY 2009 and in CDC-OD ranges from 2.2% in FY 2004 to 16.0% in FY 2007. There was little or no censoring in stages FRN, HHS, and OMB. The restriction of the mean to 273 days primarily affected the CDC-NC and CDC-OD stages, where 6.6%–7.7% of values exceeded 273 days. The extent of censoring becomes further apparent when the quantiles of time in stage are depicted (Figure 2).
Figure 2. Distributions of time in stage, by fiscal year.
Within each combination of stage and fiscal year, the distribution depicts the 10th, 25th, 50th, 75th, and 90th centiles. A small x indicates that the 90th centile exceeds 273 days. CDC: Centers for Disease Control and Prevention. CDC-NC: CDC National Center. CDC-OD: CDC Office of the Director. FRN: Federal Register Notice. HHS: Department of Health and Human Services. OMB: Office of Management and Budget.
Structured description: Five stacked panels (one per stage: OMB, HHS, CDC-OD, CDC-NC, FRN, top to bottom), each plotting duration in stage (days, log-like axis with break marks at 0/56/91/182/273 or similar) against fiscal year (2004–2009) on the shared x-axis. Each fiscal year’s distribution within a panel is shown as a vertical spread of dots (10th/25th/50th/75th/90th centiles, large dot = median) connected by a vertical line; an “x” above a stem marks that the 90th centile exceeds 273 days (visible for CDC-OD in FY2005–2007 and for CDC-NC in FY2006–2009). OMB and HHS panels show comparatively narrow, stable spreads across years; CDC-OD and CDC-NC panels show wide spreads with visible year-to-year shifts in the median (CDC-OD peaks in FY2005; CDC-NC in FY2006); FRN durations are uniformly short (under ~56 days).
FRN Stage: The median time between receipt of the 60-day Federal Register notice and its publication peaked in FY 2006 and 2007. Fiscal year 2006 shows more variation than the earlier fiscal years, with both a wider interquartile range and a wider interdecile range.
CDC-NC Stage: The durations between the end of the public comment period and the National Centers’ submission of the information collection request to CDC-OD vary widely, with 10%–25% submitted before 2 weeks after public comment ends, but another 10% taking over 7 months in FY 2004–2005 and over 9 months in FY 2006–2008. The median duration peaked in FY 2006 and dropped considerably between 2006 and 2007.
CDC-OD Stage: As with the CDC-NC stage, the duration between submission to CDC-OD and transmission to HHS shows tremendous variation. For reviews that began in FY 2005–2007, at least 10% took more than 9 months; in FY 2005, nearly 25% took longer than 9 months. The median duration peaked in FY 2005 and dropped each of the next 3 years.
HHS Stage: The span from the time CDC-OD submits the information collection request to HHS until HHS transmits it to OMB moved the fastest in FY 2006 and has averaged about 3 weeks in the past 3 years.
OMB Stage: The duration of OMB review peaked notably in FY 2008 and improved markedly in FY 2009.
The hazard regression models that contain fiscal year (Table 2) demonstrate significant variation by information collection request type in each stage except FRN (P < 0.001 by the likelihood ratio test on 2 degrees of freedom), with the slowest rates in new information collection requests. Furthermore, there is significant variation by fiscal year in stage-specific processing times for every stage (P < 0.001 by the likelihood ratio test on 5 degrees of freedom).
Table 2. Log-hazard terms and standard errors for stage-specific hazard regression models with fiscal year term.
| FRN | CDC-NC | CDC-OD | HHS | OMB | ||||||
|---|---|---|---|---|---|---|---|---|---|---|
| FY2004 | 1.047 (0.171) | ‡ | 0.701 (0.171) | ‡ | 1.206 (0.199) | ‡ | –1.283 (0.198) | ‡ | –0.515 (0.185) | † |
| FY2005 | 0.423 (0.173) | † | 0.621 (0.189) | † | –0.123 (0.204) | –0.908 (0.204) | ‡ | –0.216 (0.198) | ||
| FY2006 | referent | referent | referent | referent | referent | |||||
| FY2007 | 0.039 (0.158) | 0.257 (0.173) | 0.404 (0.203) | † | –1.473 (0.199) | ‡ | –0.184 (0.195) | |||
| FY2008 | 1.208 (0.181) | ‡ | 0.279 (0.185) | 1.385 (0.214) | ‡ | –1.457 (0.197) | ‡ | –0.971 (0.191) | ‡ | |
| FY2009 | 1.416 (0.165) | ‡ | 0.111 (0.184) | 1.282 (0.216) | ‡ | –1.525 (0.208) | ‡ | –0.012 (0.206) | ||
| New | referent | referent | referent | referent | referent | |||||
| Rev | –0.038 (0.111) | 0.845 (0.122) | ‡ | 0.780 (0.128) | ‡ | 0.131 (0.118) | 0.648 (0.118) | ‡ | ||
| Ext | 0.116 (0.144) | 0.873 (0.151) | ‡ | 0.670 (0.152) | ‡ | 0.606 (0.156) | ‡ | 0.667 (0.158) | ‡ |
‡P < 0.001, †P < 0.05. Cell values are log-hazard regression coefficients (standard error). Rows FY2004–FY2009 are fiscal-year terms (referent FY2006); rows New/Rev/Ext are information collection request type terms (referent: New collection).
The time-in-process index was derived from the above model by computing the restricted-mean number of days in each stage in each fiscal year, adjusted to a standard mixture of information collection requests (60:15:25). This index peaked at 454 in FY 2006 – the same year that the duration of stage CDC-NC peaked. Stage CDC-OD peaked at 160 days in FY 2005, while stage OMB peaked at 133 days in FY 2008.
Table 3. Time-in-process (TIP) index by fiscal year, using restricted-mean days in each stage adjusted for information collection request type.
| Fiscal year | FRN | Public | CDC-NC | CDC-OD | HHS | OMB | Total |
|---|---|---|---|---|---|---|---|
| FY 2004 | 18.1 | 60.0 | 54.0 | 70.9 | 17.9 | 108.3 | 329.1 |
| FY 2005 | 25.5 | 60.0 | 59.8 | 160.1 | 13.7 | 94.9 | 413.9 |
| FY 2006 | 36.1 | 60.0 | 111.8 | 151.3 | 8.1 | 86.5 | 453.8 |
| FY 2007 | 34.8 | 60.0 | 89.1 | 121.8 | 21.0 | 93.6 | 420.3 |
| FY 2008 | 16.8 | 60.0 | 87.2 | 62.0 | 20.7 | 132.9 | 379.6 |
| FY 2009 | 15.4 | 60.0 | 101.9 | 67.0 | 22.0 | 86.9 | 353.2 |
CDC: Centers for Disease Control and Prevention. CDC-NC: CDC National Center. CDC-OD: CDC Office of the Director. FRN: Federal Register Notice. FR: Federal Register. HHS: Department of Health and Human Services. OMB: Office of Management and Budget. Values are restricted-mean days in stage (Public column fixed at 60 by regulatory definition of the comment period).
Between fiscal year 2006 and 2009, the average time in stage FRN dropped 21 days; stage CDC-NC dropped 10 days; and stage CDC-OD dropped 84 days. Outside CDC, HHS stage added an average of 14 days, and OMB increased from 87 days to 133 days and returned back to 87 days. The net result was an average decrease of 115 days through stage CDC-OD and an increase of 14 days outside CDC, with a net decrease of 101 days.
Hazard regression models with P-splines provide further visual clues (Figure 3) about the changes in processing duration over time. For example, although the restricted mean time in stage CDC-NC was highest in FY 2006, the mean did not change substantially over the next 3 years; indeed, the quantile plots show that the distribution of duration in stage CDC-NC became much more variable by FY 2009. In contrast, the decline in processing time in stage CDC-OD was accompanied by a contracting distribution, such that the 90th centile was below the peak mean. Finally, the peak duration in the OMB stage in FY 2008 stands out in contrast to similar mean processing times in other fiscal years.
Figure 3. Mean time in stage by date each stage was entered.
Restricted means (restricted to 273 days) are computed from hazard regression models with P-spline terms. Grayed elements from figure 2 provide further context.
Structured description: Five stacked panels (OMB, HHS, CDC-OD, CDC-NC, FRN, top to bottom), each plotting a smooth P-spline restricted-mean curve (solid, with dotted confidence band) over date entering the stage (x-axis: 2003-10 to 2009-10), overlaid with grayed point-and-whisker centile markers from Figure 2 for context. OMB curve is roughly flat (~90–95 days) through 2007, rises to a peak (~145 days) around 2008, then falls to ~80 days by 2009-10. HHS curve is low and flat (~20–30 days) throughout, with a slight step increase after about 2007-10. CDC-OD curve rises from ~70 days (2003-10) to a peak near ~170 days around 2005-10/2006, then declines steadily to ~65 days by 2008–2009. CDC-NC curve rises from ~80 days to a peak (~115 days) around 2005-10/2006, dips, then stays around 90–100 days through 2009. FRN curve stays low (~10–35 days) with a mild hump around 2005–2006.
By stacking these stage-specific means (Byron and Wattenberg 2008) to create the time-in-process (TIP) index (Figure 4), a picture forms of the efficiency of the overall system at each point in time – with the longest TIP index in the neighborhood of 2005-10-01, dominated by the process time in stage CDC-OD. Furthermore, as the duration in stage CDC-OD decreased in subsequent years, the overall TIP index also decreased, despite little change in stage CDC-NC and a transient increase in the OMB stage.
Figure 4. Time-in-process index by date each stage was entered.
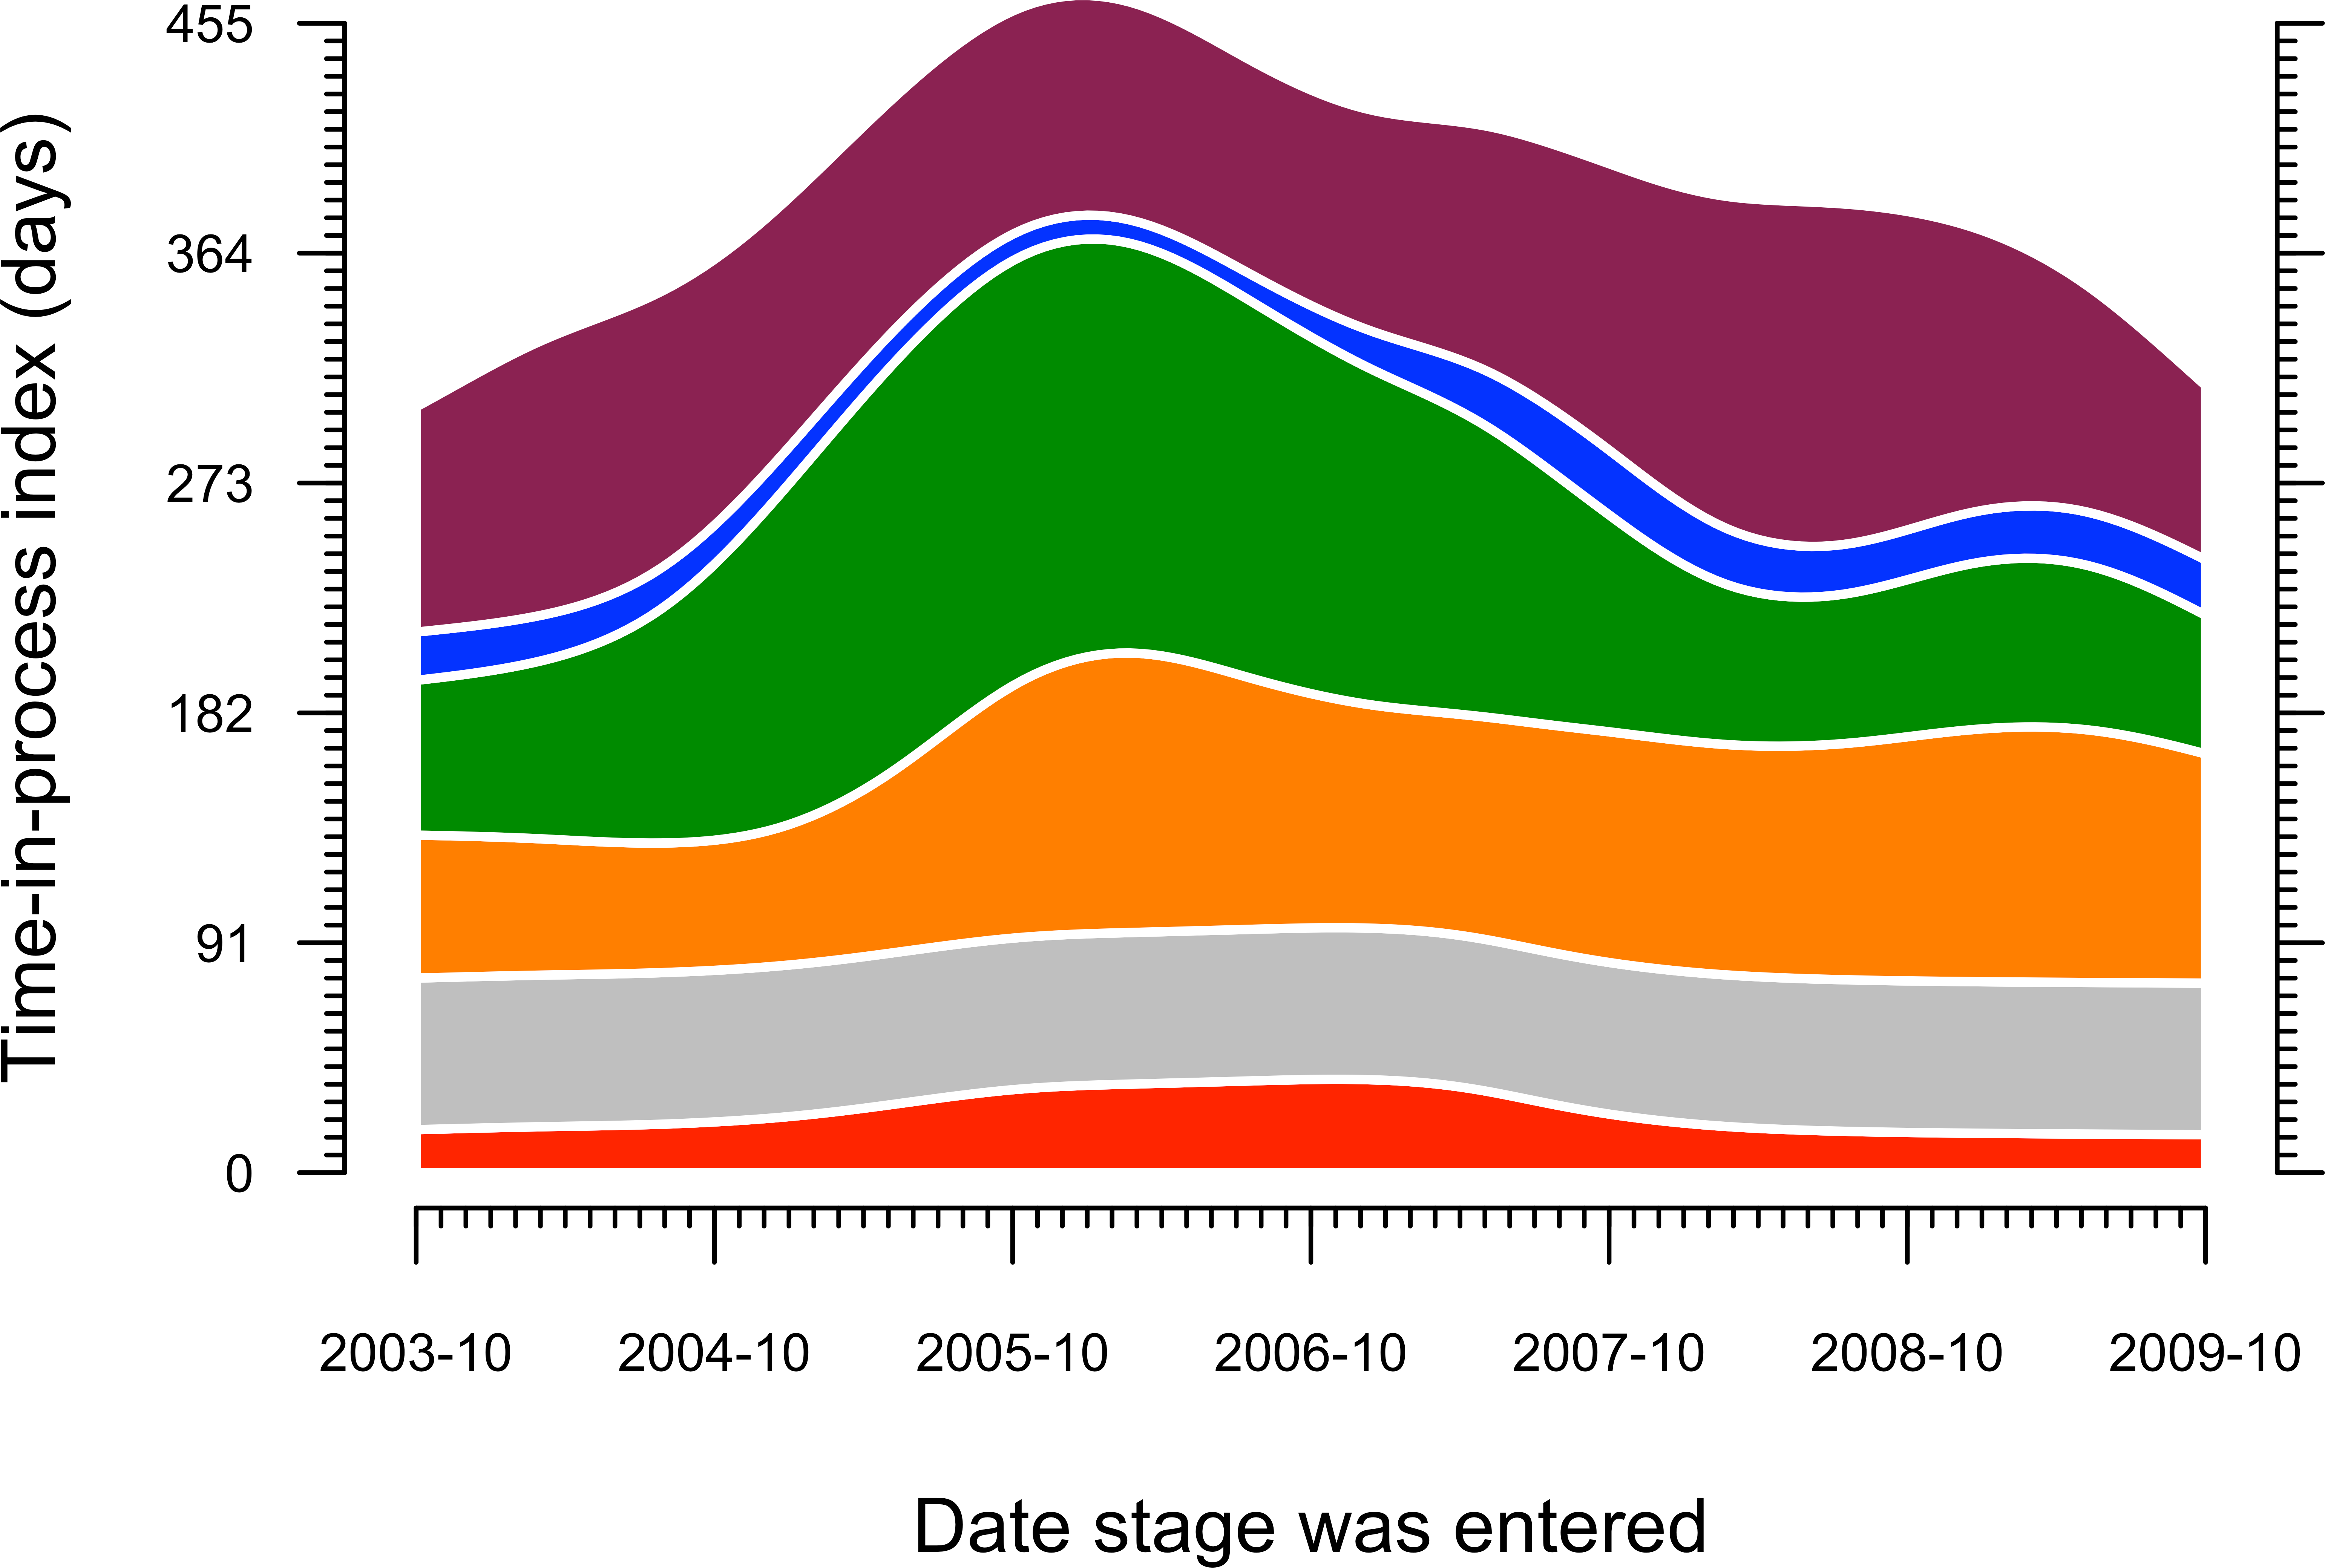
The time-in-process index is the sum of stage-specific restricted means (restricted to 273 days) from hazard regression models with P-spline terms.
Structured description: A stacked-area (streamgraph-style) chart plotting the time-in-process index (days, 0–455) against date stage was entered (2003-10 to 2009-10). Five colored bands are stacked in a fixed vertical order from bottom to top: FRN (red), Public (gray, fixed 60-day band), CDC-NC (orange), CDC-OD (green), HHS (blue, thin), OMB (maroon/purple, top). The total stack height (the TIP index) rises from about 310 days in 2003-10 to a peak near 455 days around 2005-10/2006, driven mainly by the expanding green (CDC-OD) band, then declines to about 310–320 days by 2009-10 as the CDC-OD band contracts; the orange (CDC-NC) band also expands during the peak period and stays elevated afterward; the maroon (OMB) band widens somewhat toward 2008 before narrowing again by 2009.
Discussion
These results show that the average time for Paperwork Reduction Act reviews has decreased within CDC since 2006, especially following substantive changes to administrative processes in fiscal year 2007, such as restructuring of the review process within CDC-OD and expanded guidance for investigators in CDC-NCs. Those changes followed extensive analysis and discussion by a CDC workgroup with broad internal representation. The workgroup set a target of 23 weeks for internal Paperwork Reduction Act reviews. As of fiscal year 2009, the FRN stage now averages about 3 weeks less than it did in fiscal year 2006. The average time in the CDC-NC stage has fallen about 1–2 weeks. The CDC-OD stage passed 12 weeks faster on average between fiscal year 2006 and 2009, with the most recent year in maintenance. The data sources do not allow this decrease to be parsed between program and CDC-OD activities. In light of the modest changes in the CDC-NC stage, it seems likely that CDC-OD office processes have improved and that programs are somewhat more responsive during this stage of information collection request review than they were in previous fiscal years. The ambitious recommendations of the internal CDC workgroup would require an additional decrease of about 12 weeks in internal reviews.
Investigators must anticipate review times under Paperwork Reduction Act both within CDC and outside CDC. The latter portion increased slightly during the period analyzed here. The HHS segment of the review has added an average of 2 weeks since fiscal year 2006, for a mean total of 3 weeks in that stage. In addition, OMB review added almost 7 weeks between fiscal year 2006 and fiscal year 2008 and then shed nearly 7 weeks by fiscal year 2009. The average duration at the Office of Management and Budget was 12 weeks, well over the 60 days allotted by regulation (5 CFR 1320.10(b)). Indeed, 58% of information collection requests submitted by CDC to the Office of Management and Budget in fiscal year 2009 remained at the Office of Management and Budget longer than 60 days. Combining the internal and external changes, between a net mean decrease within CDC of over 16 weeks and a net mean increase outside CDC of about 2 weeks, the Paperwork Reduction Act process mean total decreased just over 14 weeks from fiscal year 2006 to fiscal year 2009.
The 4-month decline in internal processing time should catalyze further improvements and supports continued internal monitoring of process time across all stages. Now that CDC has shown progress in honing internal processes, it seems appropriate to assess options for improving the external Paperwork Reduction Act processes, as requested by the Office of Management and Budget in late 2009 (www.federalregister.gov 2009). Even with reduced internal process times, public health efforts would be further aided by shorter external reviews. Considering the direct costs and the opportunity costs that the Paperwork Reduction Act exacts on agencies, the Executive Branch should seek to streamline the impact of this legal requirement to achieve accountability and transparency and improve data utility, while minimizing implementation costs.
As indicated in CDC’s official comments submitted to the Office of Management and Budget in 2009 in response to the Office of Management and Budget’s request (CDC 2009), CDC favors 3 possible approaches to reduce the delays on federally sponsored science imposed by the Paperwork Reduction Act: a broader use of the Office of Management and Budget’s administrative latitude to exclude classes of information collections from Paperwork Reduction Act clearance, a broadened application of existing exclusions, or changes in the Paperwork Reduction Act itself in order to enhance CDC’s ability to heed its charge to protect the public’s health. Exclusions might include voluntary information collections that are not associated with service provision; information collections that involve the public health workforce, but not the general public; information collected in association with public health surveillance or program evaluation; and, information collected for urgent public health responses.
This analysis demonstrates support for using quality data and rigorous methods to inform administrative processes, much as they are used to inform public health activities. To meet CDC’s mission of detecting and investigating health problems, responding to urgent public health events, and protecting the public from disease and injury, CDC must be able to act based on evidence that is collected quickly and under changing circumstances. Reducing delays imposed by Paperwork Reduction Act clearance will aid CDC in achieving its mission for both urgent and chronic health concerns.
Acknowledgments
[To be provided after acceptance for publication]
References
Blank MB, Sullivan PS, Lombardo PA. When less paperwork means no science. Science Progress. 2009. Available at: http://www.scienceprogress.org/2009/09/paperwork-reduction-and-public-health/. Accessed 2010-04-06.
Byron L, Wattenberg M. Stacked graphs — geometry & aesthetics. IEEE Transactions on Visualization and Computer Graphics. 2008; 1245–1252. http://www.leebyron.com/else/streamgraph/download.php?file=stackedgraphs_byron_wattenberg.pdf.
Centers for Disease Control and Prevention. Submitted by P Briss, Acting Associate Director for Science, on 2009-12-24, in response to reference 7.
U.S. Code of Federal Regulations, Title 5, Part 1320. U.S. Code, Title 44, chapter 35, subchapter I.
Eilers PHC, Marx BD. Flexible smoothing with B-splines and penalities. Statistical Science. 1996; 11(2): 89–121.
Improving Implementation of the Paperwork Reduction Act. Federal Register. 2009; 74(206): 55259–55272. Available at http://www.federalregister.gov/articles/2009/10/27/E9-25757/improving-implementation-of-the-paperwork-reduction-act. Accessed 2010-09-06.
Government Accounting Office Report 2002. GAO-03-619T.
Karrison TG. Use of Irwin’s restricted mean as an index for comparing survival in different treatment groups—interpretation and power considerations. Controlled Clinical Trials, 1997; 18: 151–167.
Office of Management and Budget. Docket Folder Summary: Improving Implementation of the Paperwork Reduction Act. Federal Register. Docket number OMB-2009-0020. Available at http://www.regulations.gov/search/Regs/home.html#docketDetail?R=OMB-2009-0020. Accessed 2010-09-06.
R Development Core Team (2010). R: A language and environment for statistical computing. R Foundation for Statistical Computing, Vienna, Austria. ISBN 3-900051-07-0, URL http://www.R-project.org/.
Relyea HC. Paperwork Reduction Act reauthorization and government information management issues. Government Information Quarterly, 2000; 17(4): 367–393.
Rubinstein G. The quantification of information: the paperwork budget and the birth of the burden hour. Government Information Quarterly, 1990; 7(1): 73–81.
Therneau TM, Grambsch PM. Modeling survival data: extending the Cox model. 2000, New York: Springer.
Therneau T, Lumley T (original SplusR port). survival: Survival analysis, including penalised likelihood. 2010. R package version 2.36-2. http://CRAN.R-project.org/package=survival.